
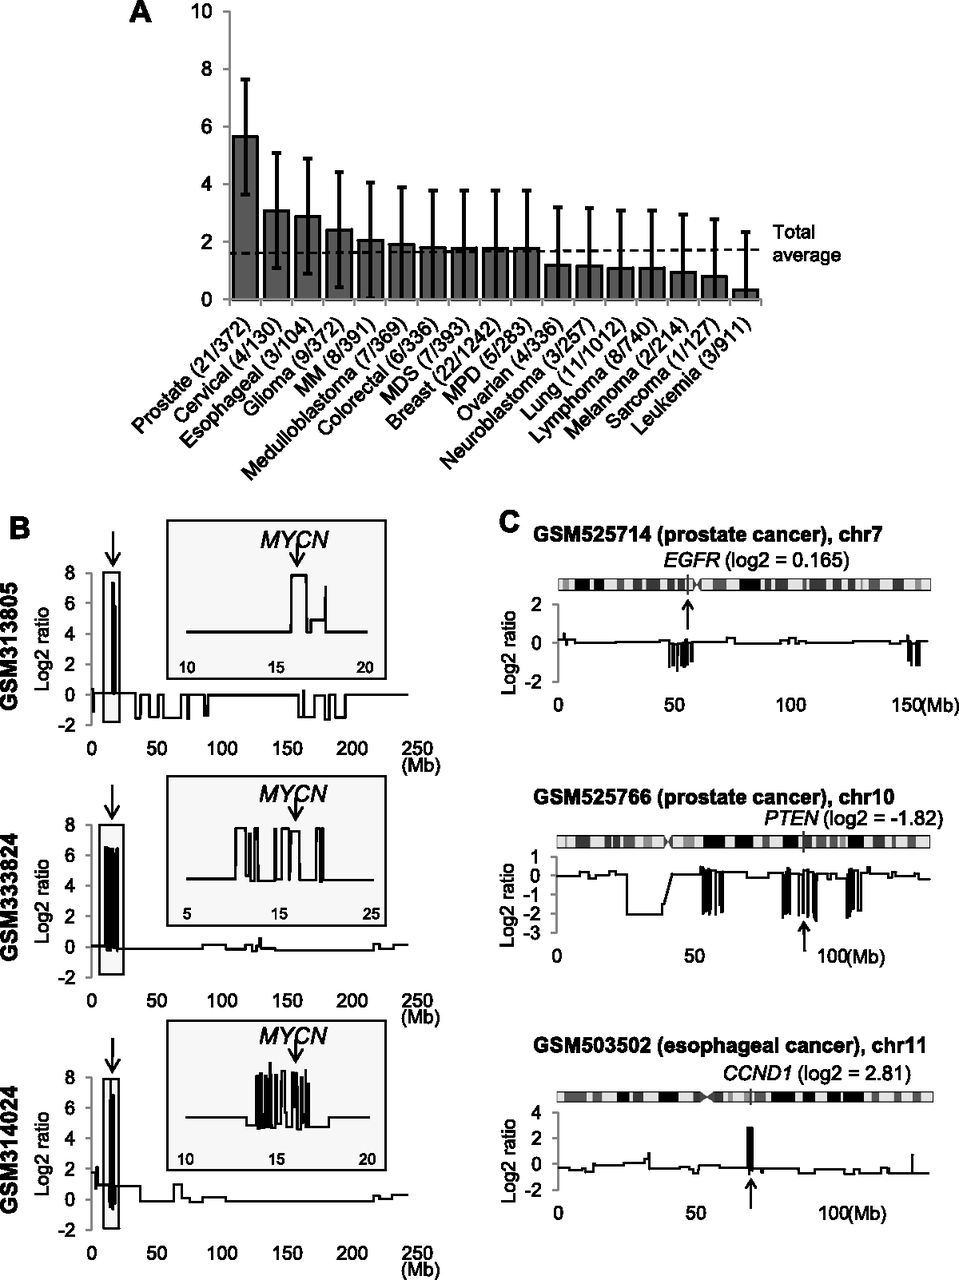
The prevalence of chromothripsis and examples of local chromothripsis involving known cancer genes. (A) The prevalence of chromothripsis measured across different tumor types is shown with 95% confidence intervals. The number of samples showing genomic evidence of chromothripsis is shown in parentheses with the total sample number associated with the tumor type. A dashed line indicates the average frequency across the entire data set. (B) Three neuroblastoma cases with evidence of chromothripsis on chromosome 2 are shown. Arrows indicate the MYCN locus, and insets show a more detailed pattern of copy number changes around the locus. (C) Three examples of local chromothripsis involving known cancer genes of EGFR, PTEN, and CCND1 loci are shown, with the log2 ratios at the cancer gene loci in parentheses.


