
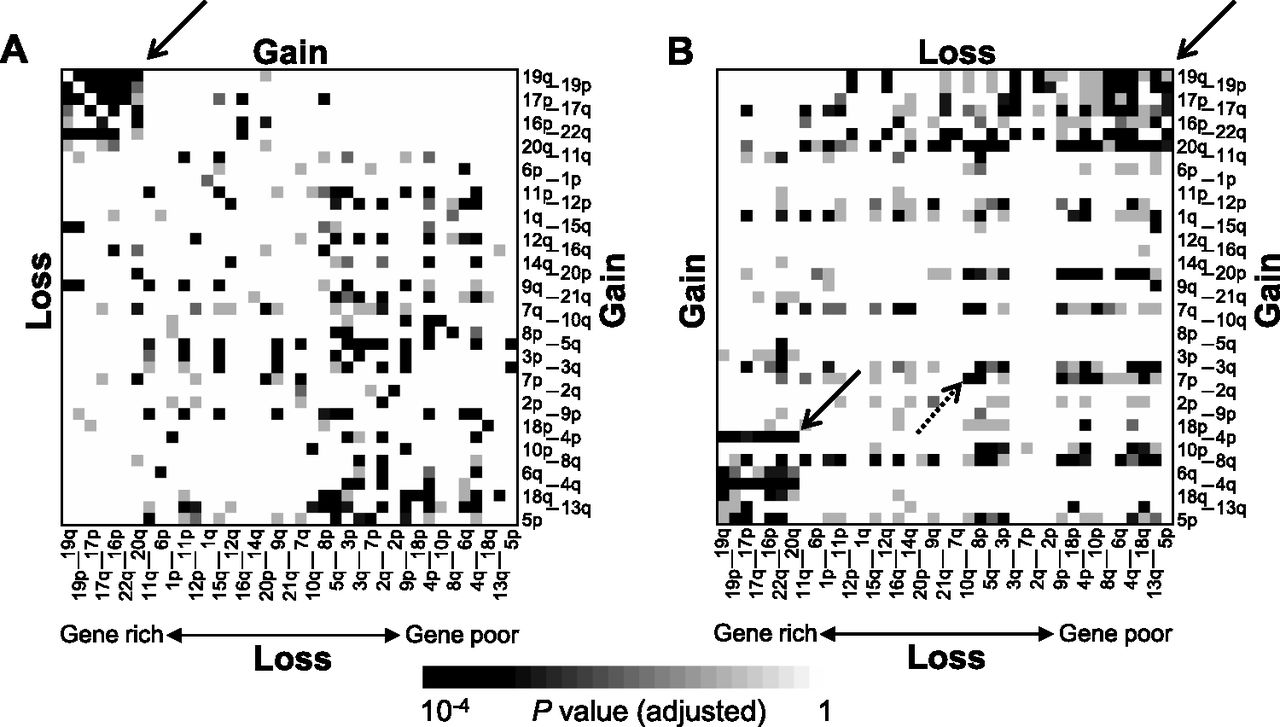
Concordant and discordant relationships between arm-level alterations. (A) The extent of concordance for chromosomal arm-level gain-gain and loss-loss is shown in the upper right and lower left triangles, respectively. The chromosomal arms are sorted by gene density (genes/Mb; e.g., 19q and 5p are the most gene-rich and gene-poor chromosomal arms, respectively). The heat map shows the multiple test-adjusted significance of concordance. The arrow marks a cluster of frequent gain-gain and loss-loss pairs between gene-rich chromosomal arms. (B) The extent of discordance between chromosomal arm-level gain-loss is shown. The two solid arrows indicate clusters of chromosomal arm pairs with frequent discordant changes between gene-rich and gene-poor chromosomal arms. The dotted arrow indicates a discordant pair between 7p gain and 10q loss.


