
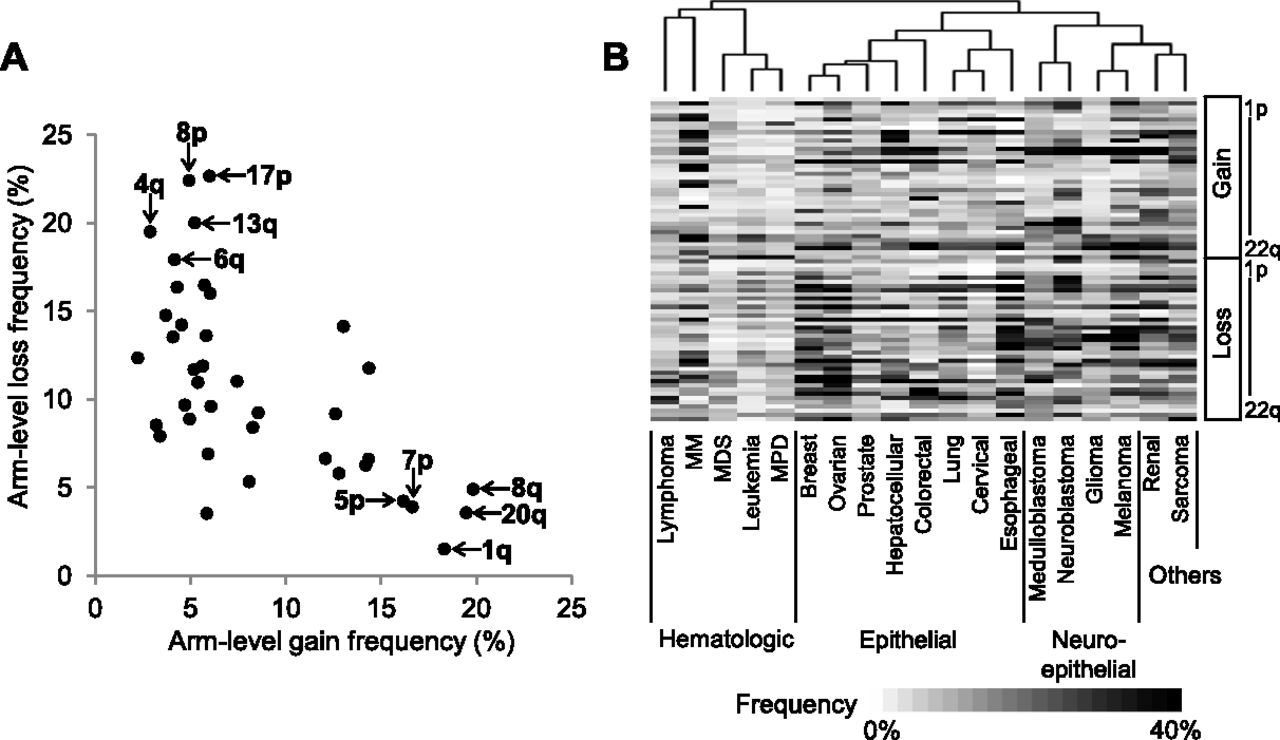
Figure 2.
Overview of chromosomal arm-level alteration frequency. (A) A scatter plot shows the arm-level alteration frequency measured across the entire data set (n = 8227). The top five most frequently gained or lost chromosomal arms are marked. Size-adjusted arm-level alteration frequencies are separately shown in Supplemental Figure S4. (B) Hierarchical clustering using the arm-level alteration frequency largely segregates 19 tumor types into three clusters of hematologic, epithelial, and neuroepithelial origins (from left to right). The heat map shows the frequency of chromosomal copy gains (above) and losses (below), ordered from 1p to 22q.


