
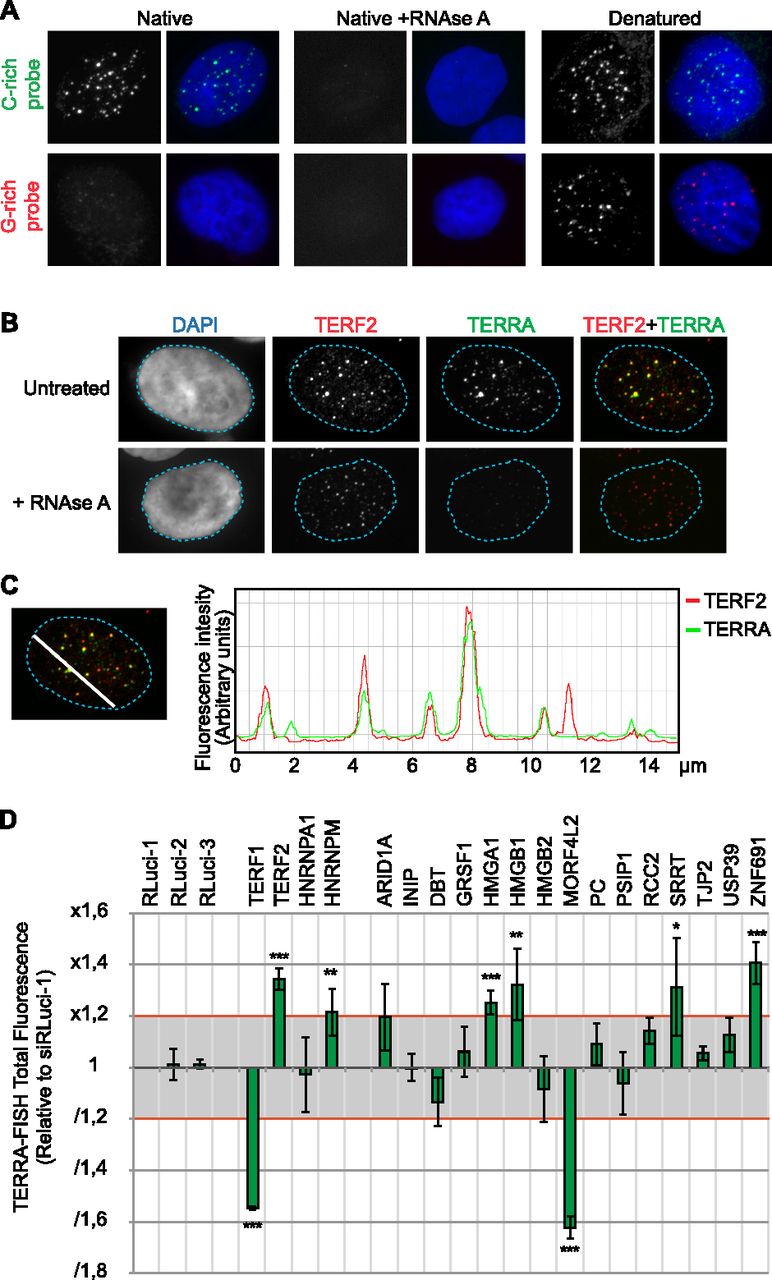
Figure 4.
Quantitative TERRA-FISH after knockdown of the candidates in HeLa 1.3. (A) RNA-FISH with CCCTAA (green, upper panel) or TTAGGG (red, lower panel) LNA probes, including RNase A and denatured controls. (B) TERRA-FISH (green) coupled with TERF2 immunofluorescence (red). (C) Representative example of 10 independent experiments of signal intensity correlation between TERF2 (red) and TERRA (green) following the indicated white line. (D) Quantification of TERRA foci in HeLa 1.3 after knockdown of the candidate genes, relative to RLuc-1. Error bars indicate SD between three independent experiments. (*) P < 0.05, (**) P < 0.01, (***) P < 0.001.


