
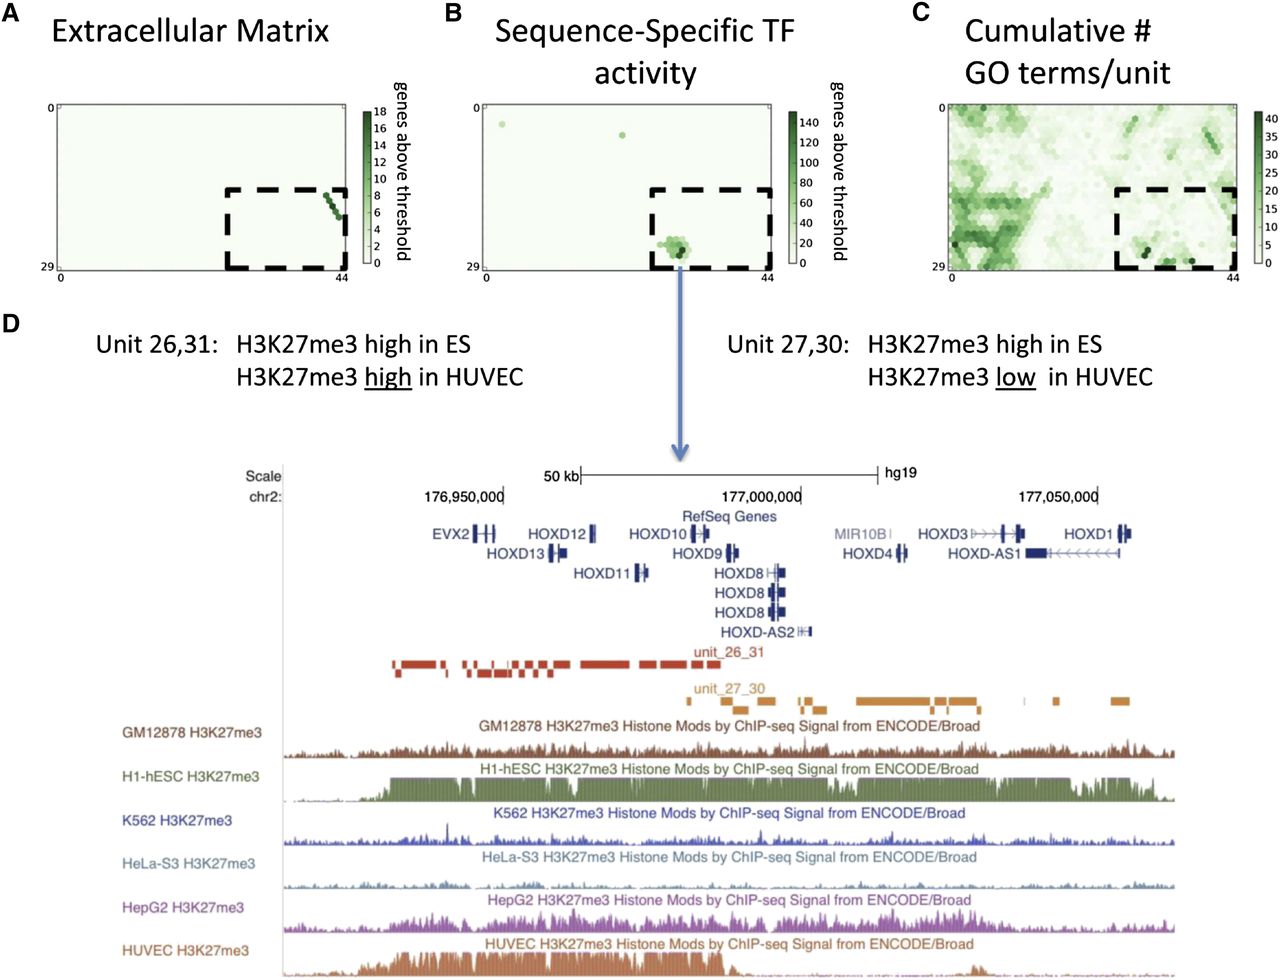
Figure 5.
Specific patterns of GO enrichment over the SOM. (A) Specific GO terms such as “extracellular matrix” are highly enriched in portions of the map because of activity in one or more cell types. (B) Other GO terms are enriched because of their pattern of repression over the map. (C) The map has overall highly uneven distribution of GO enrichments away from the regions with the highest nucleotide density. (D) An example of the different patterns of H3K27me3 distribution across cell lines captured by neighboring units in the map in the HOXD cluster.


