
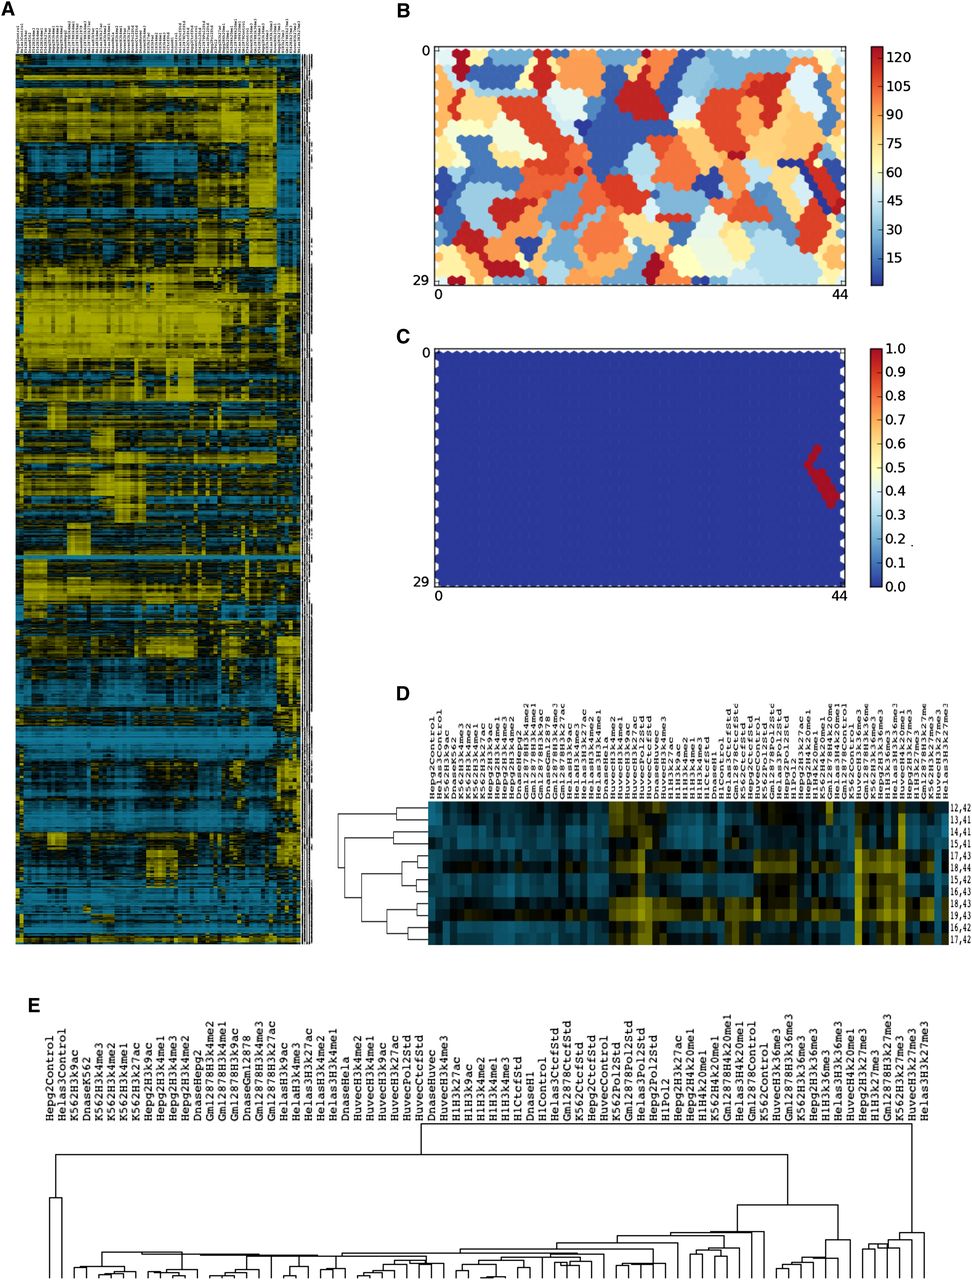
Metaclustering of the SOM. (A) Hierarchical clustering of the ranked unit weights (rows) and components (columns) shows both the large-scale and fine structure of the SOM unit ranked weights (yellow, high enrichment rank; blue, low enrichment rank). (B) Metaclustering of the SOM into ∼120 clusters based on a consistency threshold of 2.6. (C) Twelve units make up metacluster 1. (D) Ranked component weights of metacluster 1. All 12 units share enrichment in HUVEC RNA Pol II, H3K36me3, and H4K20me1. Individual units show additional distinct enrichments, which distinguish them from one another. (E) Clustering of the component columns of Figure 5A, showing the relationships of the data sets to one another.


