
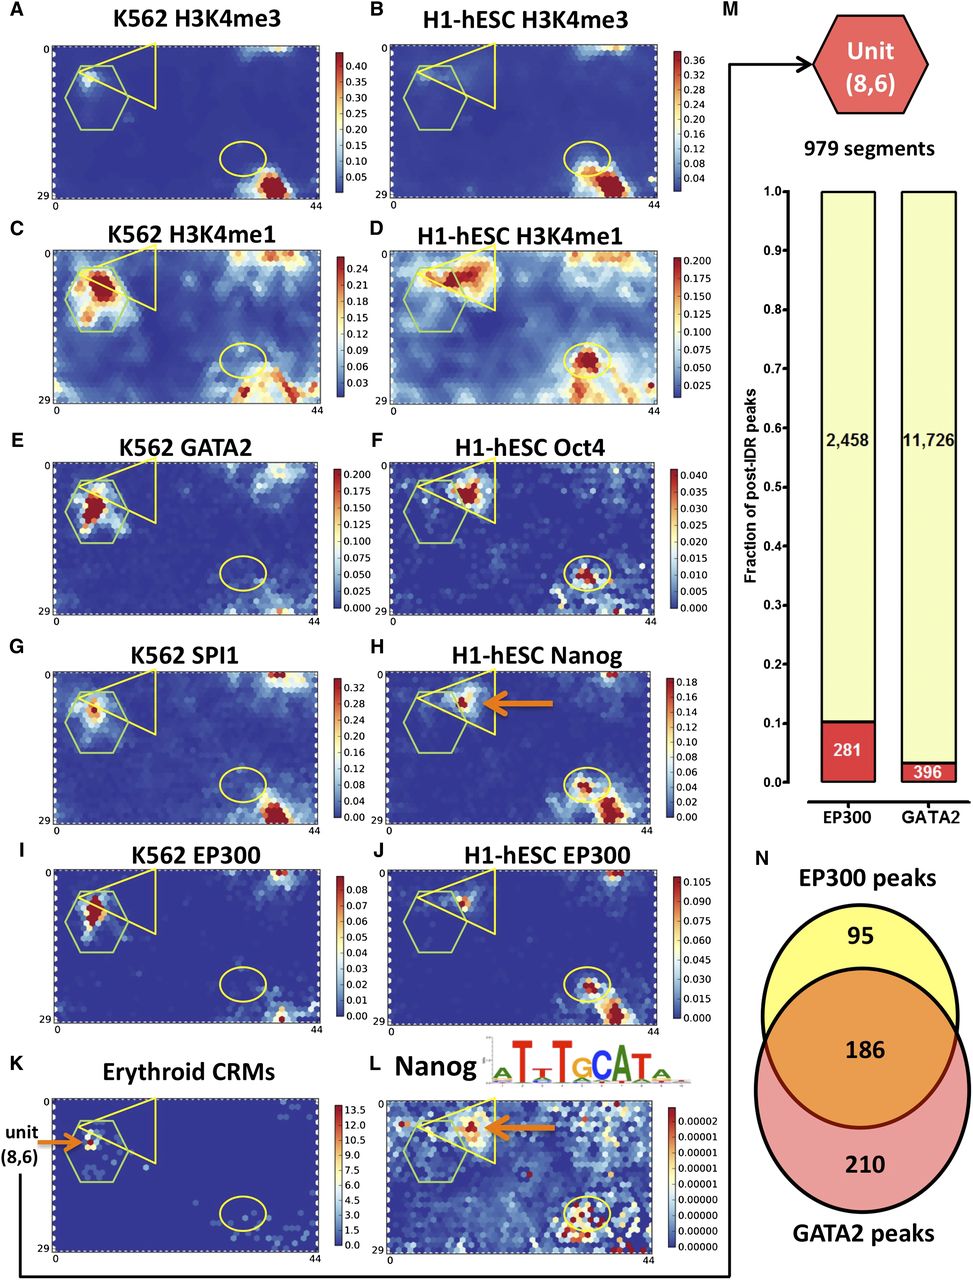
Organization of genomic functional elements on the SOM. A triangle, hexagon, and ellipse are superimposed to allow comparison between maps. (A,B) H3K4me3 signal density in K562 and H1-hESC. (C) The hexagon encompasses the K562 units high in H3K4me1. (D) The triangle and hexagon capture the two disjoint regions that are high in H3K4me1 in H1-hESC. (E) GATA2 signal, which was not used in the training, is high in a subset of the H3K4me10high units in C. (F) Similarly, POU5F1 is primarily found overlapping the H3K4me1 high units. (G,H) In contrast to GATA2 and POU5F1, SPI1 and NANOG are found primarily in units that are high in H3K4me3 (to the lower right of the ellipse) with less signal found at H3K4me1 high units. (I,J) EP300 signal (also not used in the training) is found either primarily at enhancers in K562, but promoters in H1-hESC. (K) More than one-third of known erythroid CRMs cluster into a single unit with coordinates (8, 6). (L) Conserved NANOG motifs (motif derived from NANOG ChIP-seq data). ChIP-seq occupancy and motif occurrences were defined by the uniform ENCODE ChIP-seq binding site and motif calling pipelines. Conservation was assessed using the 46-way vertebrate phastCons scores for hg19 downloaded from the UCSC Genome Browser. The scores for each unit in the motif maps were normalized for the total number of base pairs in the unit to avoid the map being dominated by units with very high number of base pairs in them. (M) Ten percent of EP300 ChIP-seq calls and 3.2% of GATA2 calls in K562 fall within the top erythroid-CRM enriched unit (8, 6). (N) Sixty-six percent of the EP300 peaks in unit (8, 6) overlap a GATA2 peak.


