
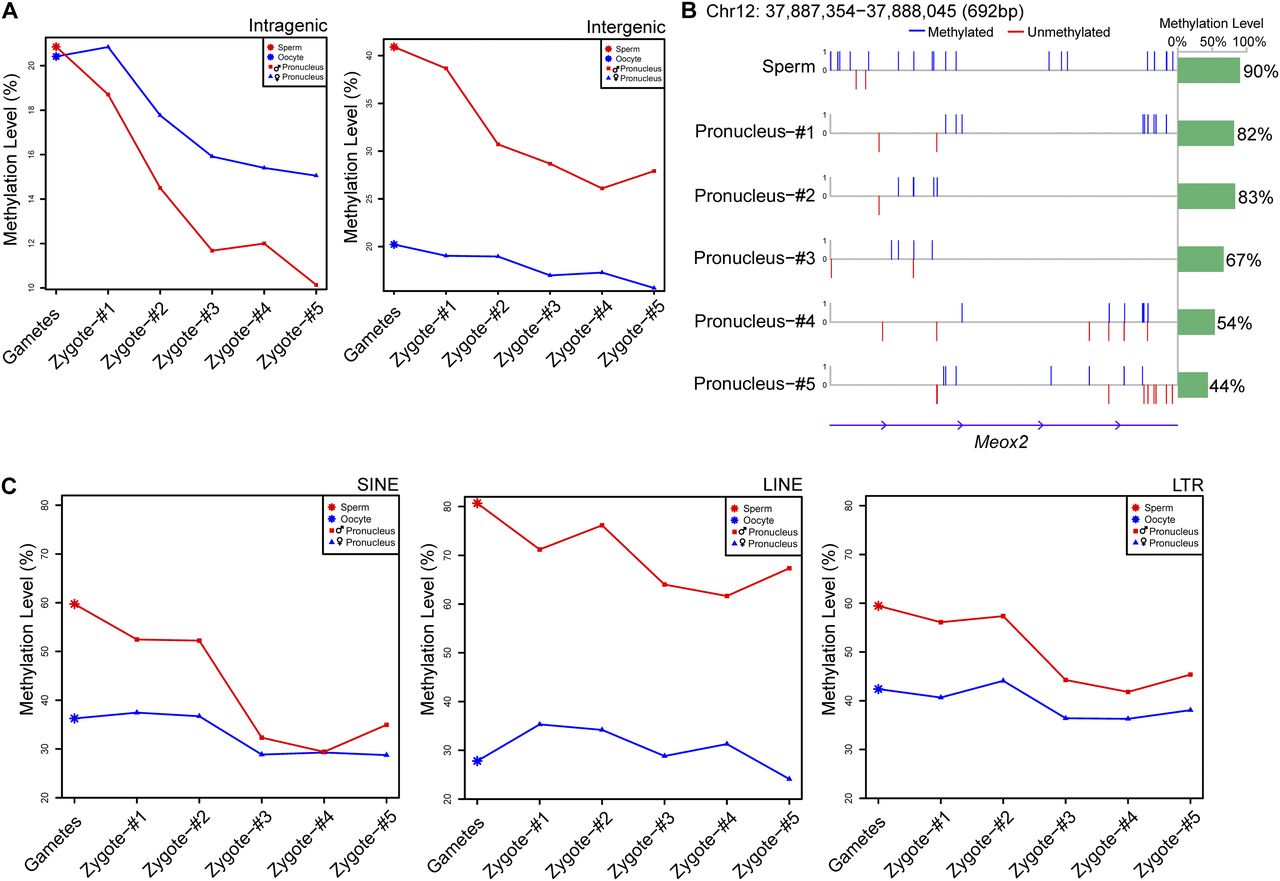
The demethylation patterns in various genomic regions in male and female pronuclei during zygotic development. (A) DNA methylation dynamics of male and female pronuclei in intragenic and intergenic regions. The methylation levels in the male (red line) and female (blue line) pronuclei decreased, whereas the demethylation in the male pronuclei was more dramatic than that in the female pronuclei. (B) The methylation profile of a representative Meox2 locus on chromosome 12 in the male pronuclei. The upward blue bars in the left panel represent fully methylated CpG sites, whereas the downward red bars represent unmethylated CpG sites. The green bar in the panel on the right shows the average methylation levels of the CpG sites in this region. (C) DNA methylation dynamics of male and female pronuclei in repeat regions. The left, middle, and right panels display the methylation levels of male and female pronuclei in the SINE, LINE, and LTR regions, respectively. Red and blue lines indicate male and female pronuclei, respectively.


