
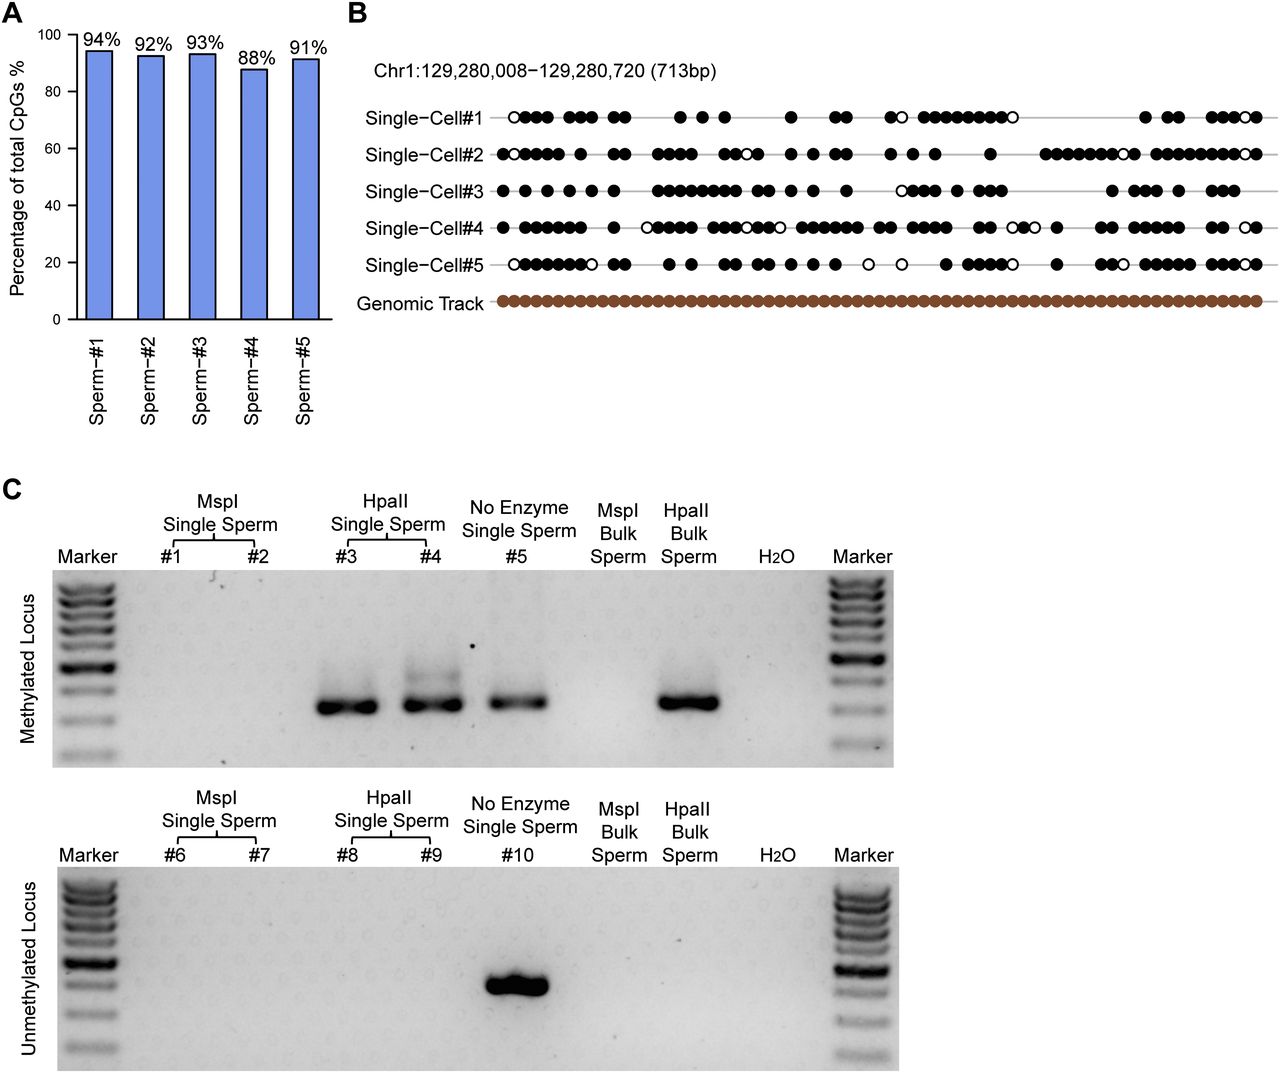
The methylation status of single sperm cells. (A) The proportion of fully methylated (≥90% methylated with read depths greater than or equal to three) and unmethylated (≤10% methylated with read depths greater than or equal to three) CpG sites within the total CpG sites covered in the scRRBS of an individual sperm cell. (B) The methylation status of a representative locus on chromosome 1 showing that most of the detected CpG sites were either methylated or unmethylated. Filled black circles represent methylated CpG sites, whereas open circles represent unmethylated CpG sites. Gaps in the methylation profiles represent CpG sites that were not recovered in the single-cell RRBS data. The filled brown circles represent all of the CpG sites in the corresponding region of the genome. (C) Agarose gel analysis of the methylation-sensitive restriction digestion coupled with nested PCR in single sperm cells. (Top) A methylated locus. (Bottom) An unmethylated locus. The first five lanes (excluding the marker lane) indicate five individual single sperm cells digested with MspI, MspI, HpaII, HpaII, and no enzyme, respectively. The next two lanes indicate 1 ng of bulk sperm genomic DNA treated with MspI or HpaII, respectively, as positive controls. A weaker band (468 bp) at the upward side of the strong band (320 bp) in the fourth lane (excluding the marker lane) of the top panel is the amplification product of the first-round PCR.


