
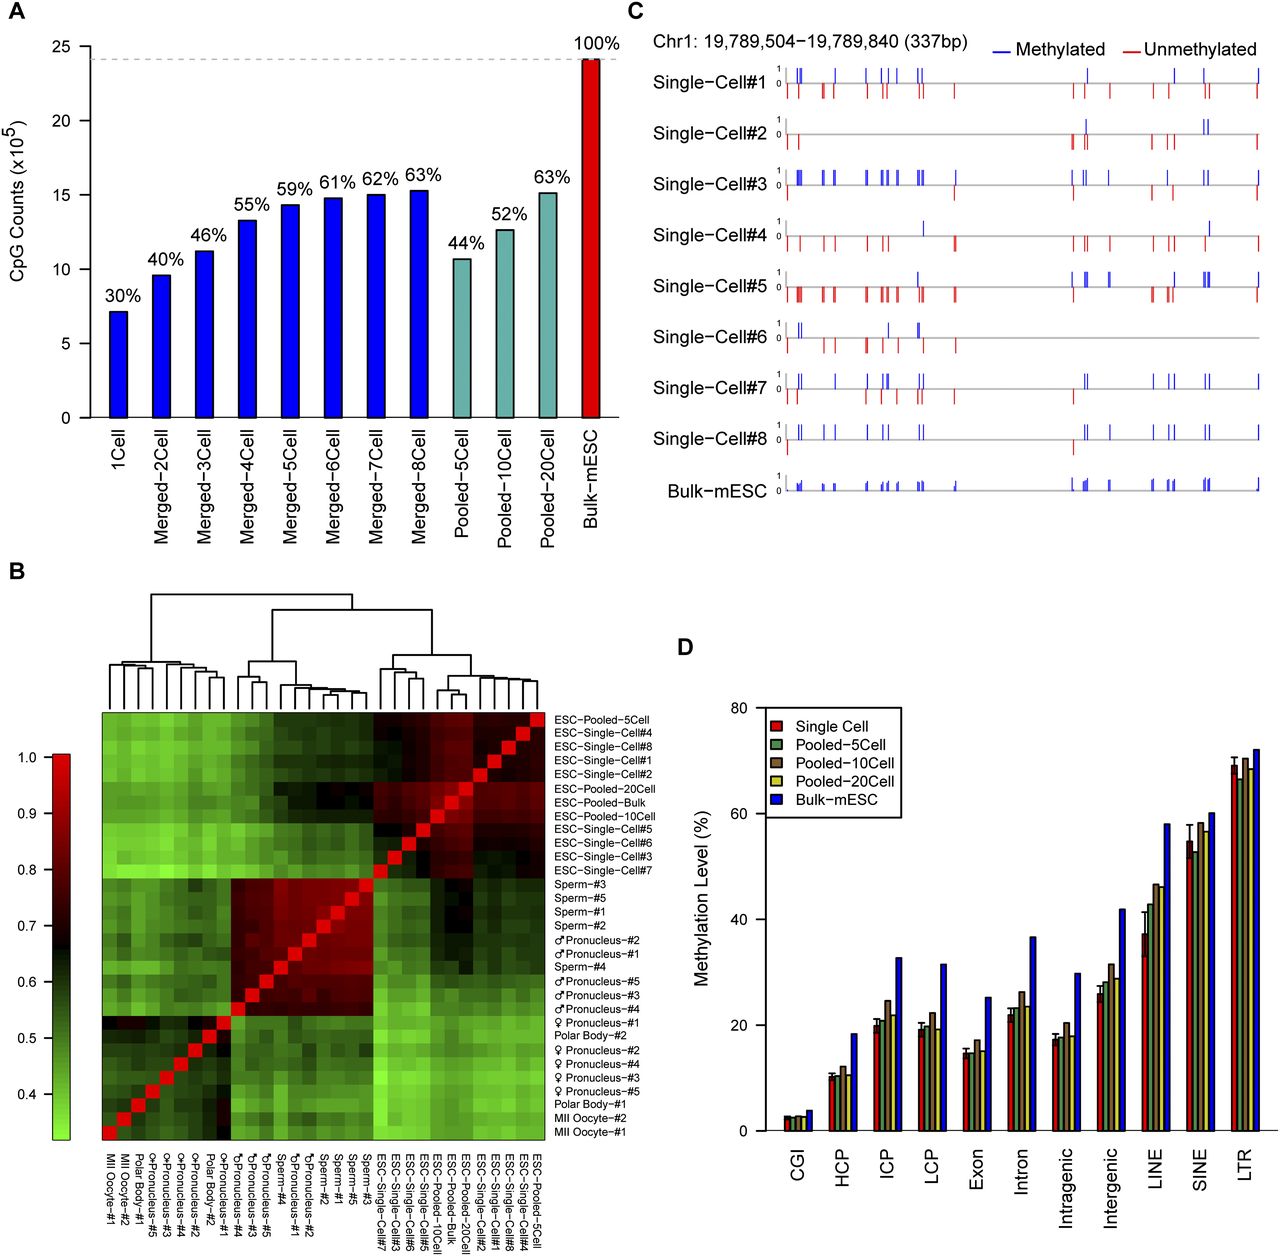
The sensitivity and reproducibility of the single-cell RRBS technique. (A) The number and proportion of CpG sites detected in the merged single mESC RRBS data set overlapped with those from the RRBS of the bulk mESCs. (B) Pearson correlation heatmap among the methylomes of all RRBS samples of single cells, pooled cells, or bulk cells. The color key from green to red indicates low to high correlation, respectively. (C) DNA methylation map of the CpG sites at a representative locus in the RRBS data from eight single cells and bulk mESCs. The upward blue bars and downward red bars indicate methylated CpGs and unmethylated CpGs, respectively. (D) The methylation levels of different genomic regions of single mESCs; pooled mESCs of five cells, 10 cells, and 20 cells; and bulk mESCs.


