
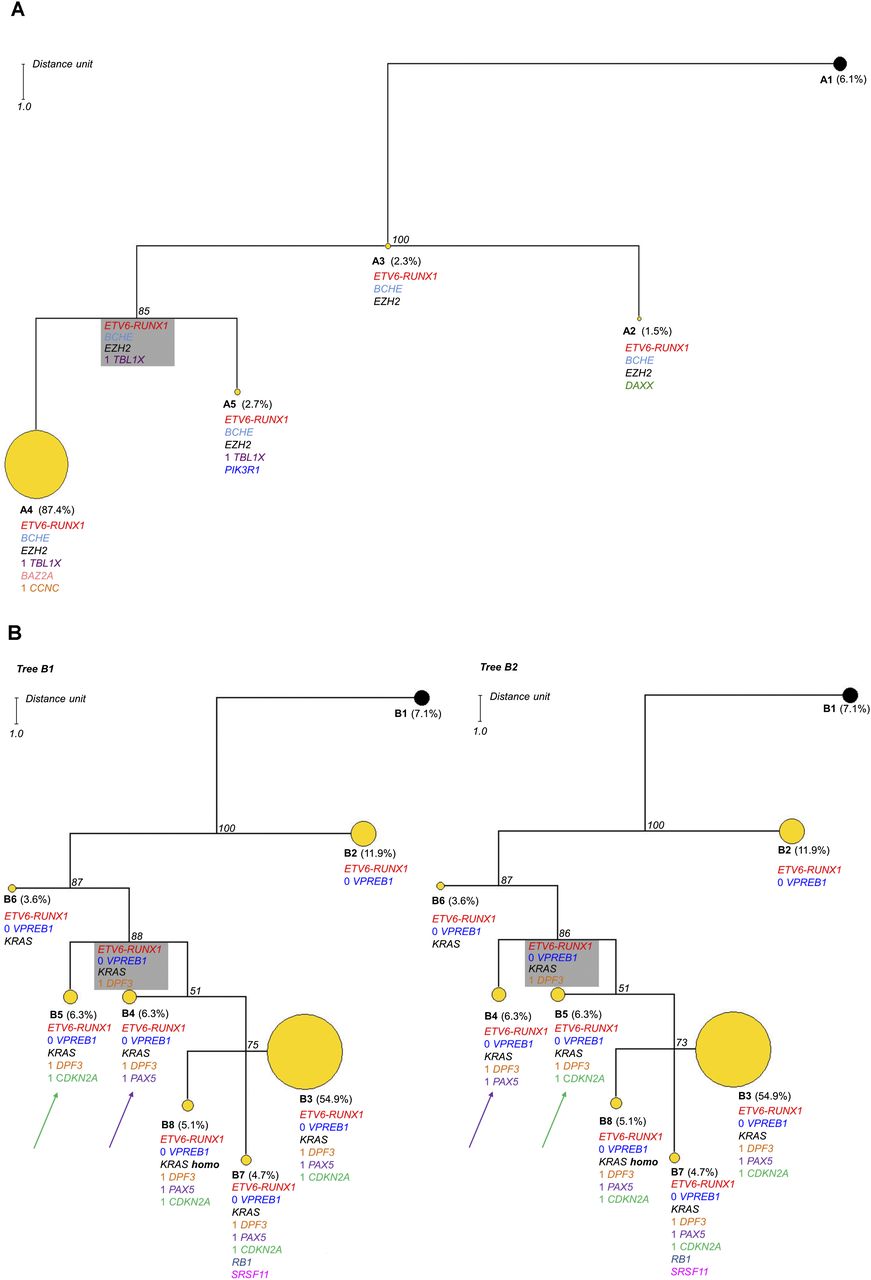
Phylogenetic analysis results for Cases A and B. In each case the observed clone is indicated by a circle. Yellow circles indicate tumor clones, and black circles indicate the normal cell population. The alterations are listed below each subclone; excluding ETV6-RUNX1, those without a number indicate the presence of a mutation and those with a number indicate DNA copies accordingly. The boxed subclone in gray is inferred; a group of cells that has died out or been outcompeted, or if still present, exists at a low frequency that cannot be reliably detected by this approach. The number in italics at each node indicates the jackknifing value. The distance unit is indicated. (A) One parsimonious tree was found for Case A consisting of four subclones with modest heterogeneity. The major clone (A4) represents 87.4% of the population. The size of each circle is proportional to the number of single cells included in the subclone except A4, which has been reduced by a third in this tree. (B) In Case B, there are two equally parsimonious trees composed of seven subclones. These two trees differ by the position of subclones B4 and B5, which are equal parsimonious ancestors to subclones B3, B7, and B8. This case shows increased heterogeneity with the major clone representing 54.9% of the population (B3). The major clone B3 is reduced by half in this tree.


