
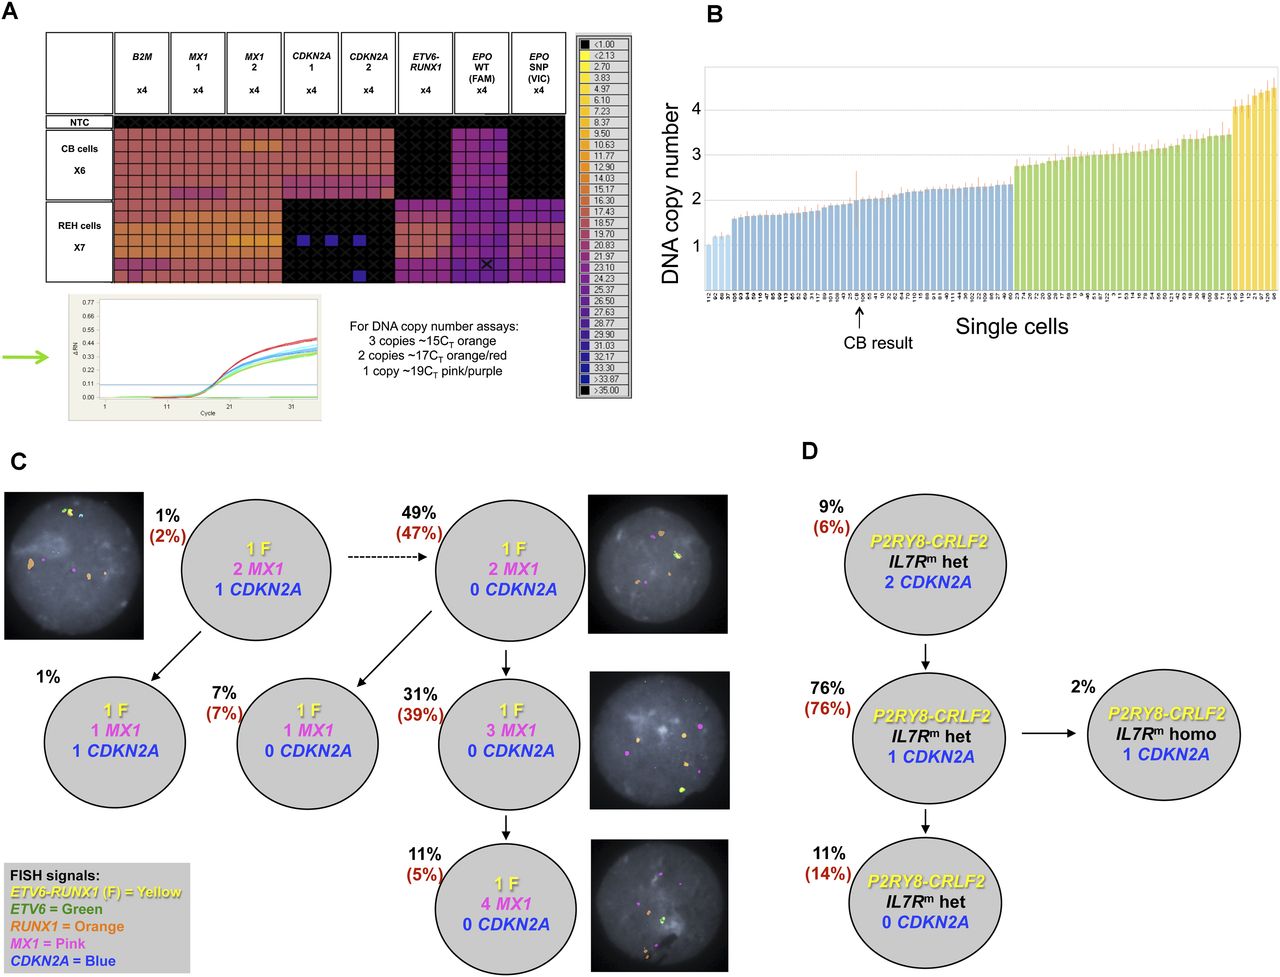
Single-cell genetic analysis of leukemic cells using the multiplex targeted Q-PCR approach and the BioMark HD platform. (A) Heatmap depicting an example of raw Q-PCR data from the BioMark HD. The rows represent single cells including six cord blood cells and seven REH cells. The columns represent assays, each completed in quadruplicate including B2M (one of three assays), MX1 (two of three assays), CDKN2A (two of three assays), the ETV6-RUNX1 fusion gene assay, and the EPOR SNP (rs318720) assay containing two Taqman probes, one complementary to the wild-type sequence (labeled with FAM) and the other complementary to the SNP sequence (labeled with VIC). The colored boxes at the junction of a row and column indicate the raw CT value (according to the key on the right) obtained for a Q-PCR reaction involving the indicated cell and assay. Assays targeting a mutation or the fusion gene provide a definitive positive or negative result indicating the presence or absence, respectively, of an alteration. The DNA copy number assays provide a raw CT value that requires further analysis (standard ΔΔCT method, Applied Biosystems) to attribute a DNA copy number to the target gene of interest for a single cell; an example can be found in B (refer to the Single-Cell Analysis section in the Methods, and Supplemental Material). (Green arrow) The Q-PCR amplification curves generated from each copy number assay for a single cord blood cell. (Black cross in a colored box) An inadequate amplification curve. (B) Graph depicting the estimated DNA copy number of MX1 attributed reliably to 89 single cells given the assay results from B2M (assay 3) and MX1 (assay 3); one of the nine estimated copy number results used to confidently attribute a DNA copy number to the gene of interest for a single cell. The height of the bar indicates the estimated DNA copy number, and the color of the bar indicates the integer; (light blue) one copy; (dark blue) two copies; (green) three copies; and (yellow) four copies. (CB) Cord blood. (C) Subclonal genetic architecture of the REH cell line inferred by multiplex targeted Q-PCR and confirmed by FISH analysis (126 and 100 cells, respectively); the percentages in parentheses are those obtained by FISH analysis. All cells harbored the ETV6-RUNX1 fusion (F) and the EPOR SNP compared with cord blood cells. DNA copy number is indicated for each gene and subclonal population. Representative FISH images are shown next to their respective subclone. (D) Subclonal genetic architecture of leukemic cells from a child with Down’s syndrome and acute lymphoblastic leukemia (DS-ALL) generated by multiplex targeted Q-PCR and FISH analysis (115 and 100 cells, respectively); 98% of cells harbored the P2RY8-CRLF2 fusion and the IL7R mutation (IL7Rm) by multiplex targeted Q-PCR. Of these, the majority were heterozygous mutations (IL7Rm hete). A minor subclone (2%) had a homozygous IL7R mutation (IL7Rm homo). Loss of CDKN2A was subclonal to the IL7R mutation and proceeded to homozygous loss in 11% of cells. FISH for the P2RY8-CRLF2 fusion and CDKN2A copy number confirmed these results (percentages in parentheses); the IL7R mutation cannot be detected by FISH.


