
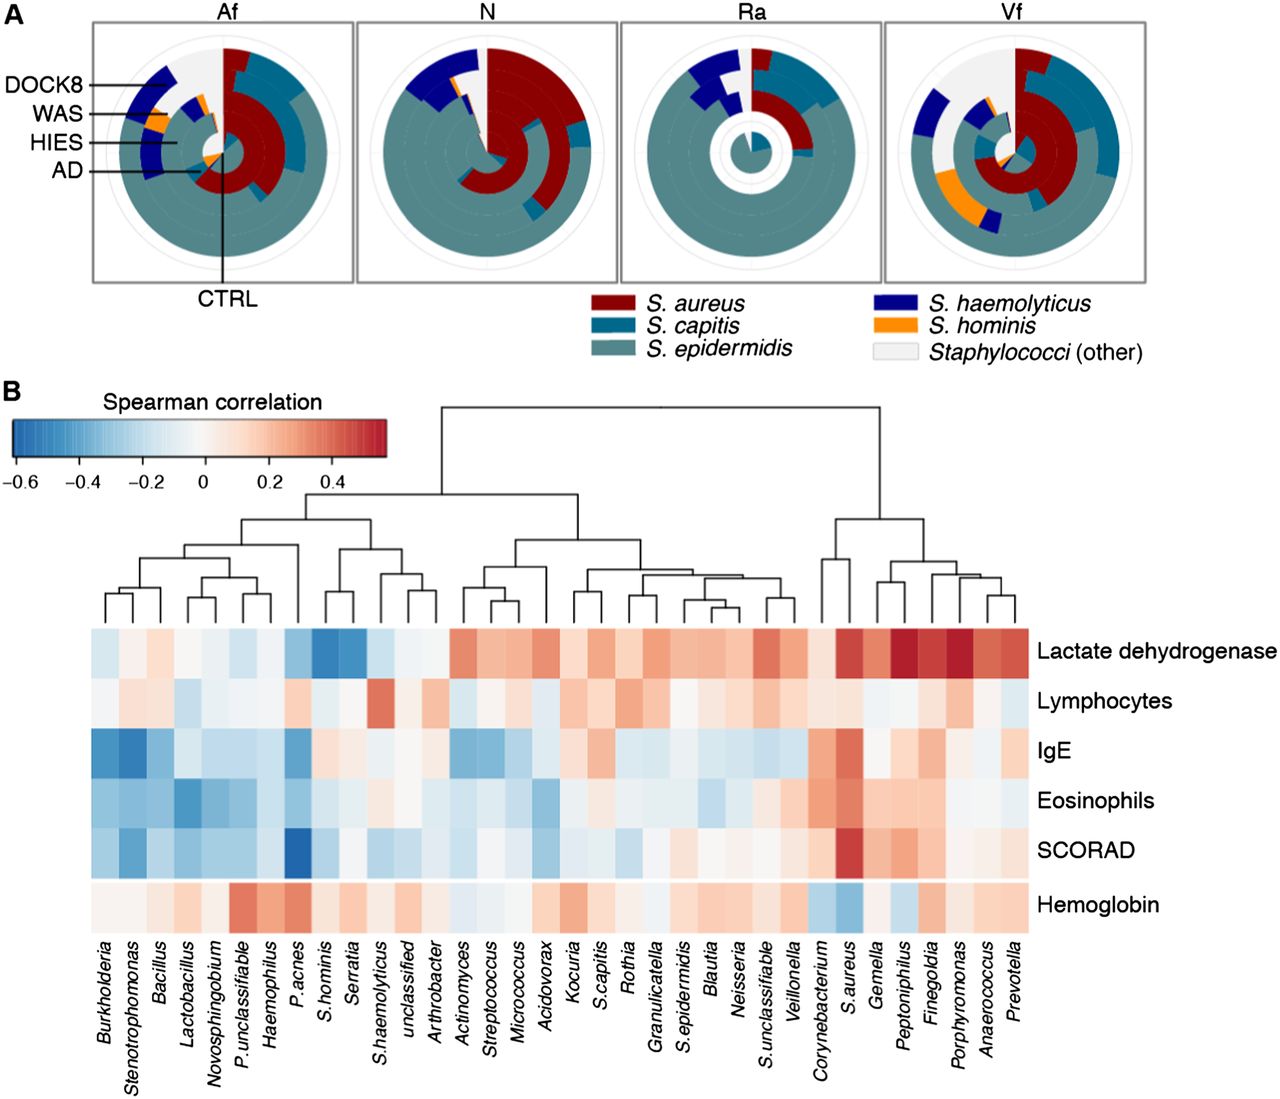
Taxonomic association with clinical features. (A) Pie charts comparing the mean relative representation of major staphylococcal species across patient groups at all sites. Site codes: (Af) antecubital fossa; (N) nares; (Ra) retroauricular crease; (Vf) volar forearm. (B) Correlation of taxonomy with clinical markers of disease severity for the antecubital fossa. Unsupervised hierarchical clustering of Spearman correlation coefficients for the 34 taxa whose mean abundance was >0.25% across STAT3-HIES patients. Correlations are calculated against blood levels of lactate dehydrogenase, lymphocytes, IgE, and eosinophils, and a score of skin disease severity (scoring atopic dermatitis [SCORAD]). Hemoglobin was a control. Reds indicate correlation; blues indicate anti-correlation.


