
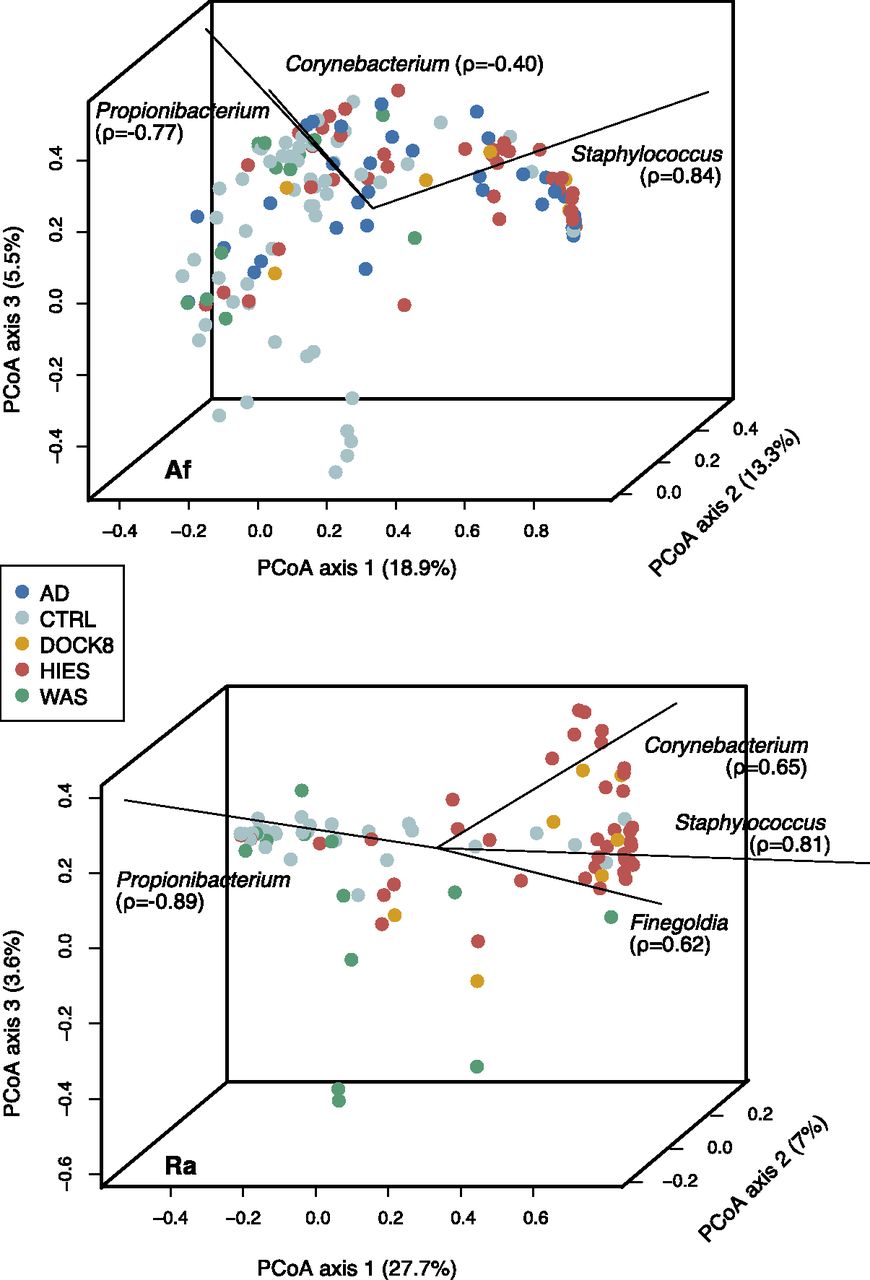
Taxonomies associated with variation within and between individuals. Principal coordinates analysis (PCoA) of the Yue-Clayton theta coefficient, which calculates the similarity between two samples based on (1) number of species in common between two samples, and (2) their relative abundances. Samples that have similar principal coordinates appear closer together, i.e., are more similar. Biplot lines indicate the most significant unique consensus taxonomies contributing to variation along axis 1; Spearman correlations (ρ) are with axis 1. Length of biplot lines reflects the contribution of that taxa to the top three axes. Associated P-values < 2.2 × 10⁻¹⁶. Percentage variation attributed to an axis is indicated. Antecubital fossa (Af) and retroauricular crease (Ra) are shown in A and B, respectively; nares and volar forearm are shown in Supplemental Figure S6.


