
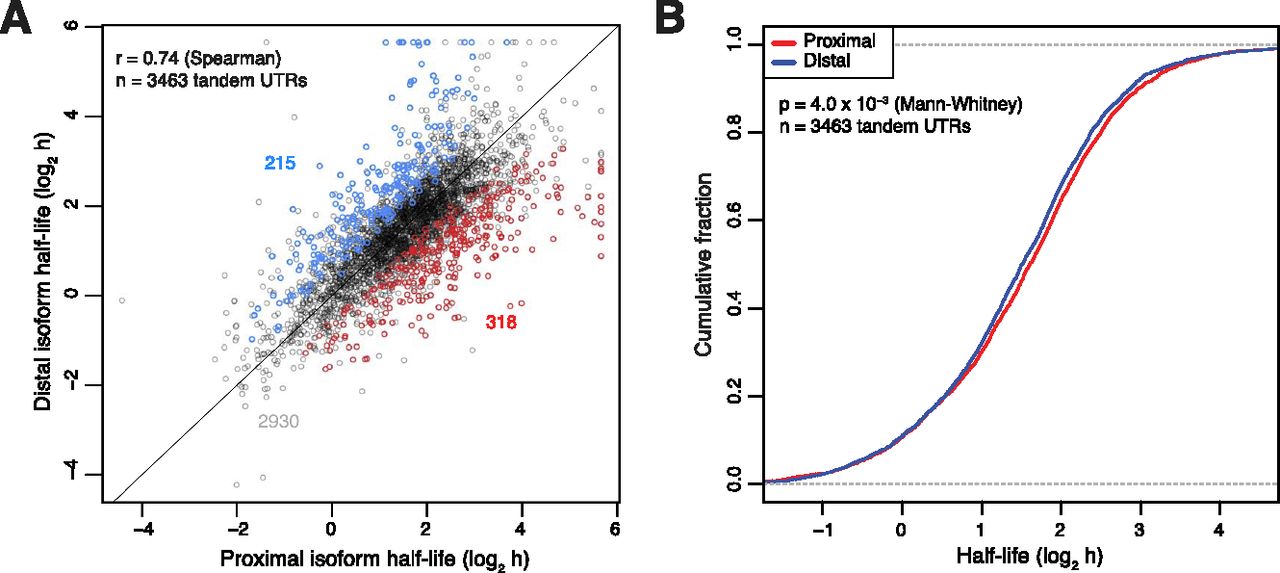
Figure 3.
Isoform-specific quantification of mRNA stability. (A) Relationship between half-lives of the adjacent proximal and distal tandem 3′ UTR isoforms' half-lives, highlighting the statistically significant differences (P < 0.05, colored points) and their tallies (colored numbers). (B) Cumulative distribution function of data shown in A. Plotted is the fraction of genes with half-life exceeding the value of the x-axis. The very slight shift toward more stable proximal tandem UTR isoforms is statistically significant (P = 4.0 × 10⁻³, Mann-Whitney test, n = 3463 tandem isoform pairs).


