
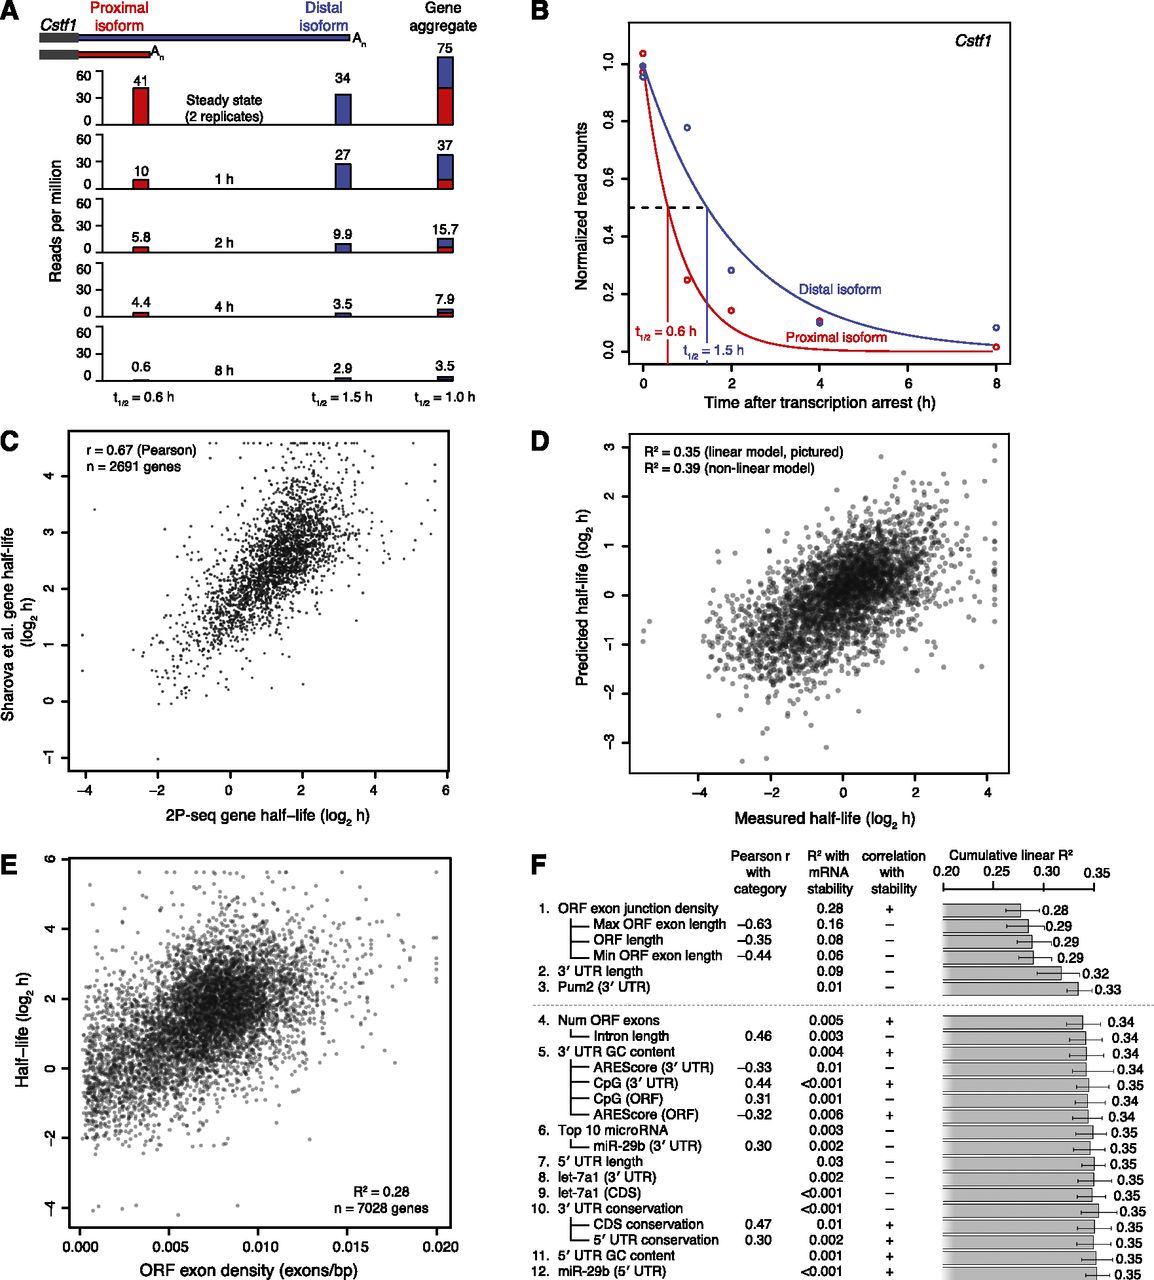
mRNA and isoform half-life values, and modeling of associated mRNA features. (A) Schematic of approach used to measure half-lives of tandem 3′ UTR isoforms. Distal and proximal isoforms are illustrated for cleavage stimulation factor subunit 1 (Cstf1). For each time point after transcriptional arrest with actinomycin D, 2P tags are plotted for each isoform as well as a gene-level aggregate, showing the corresponding half-life estimates below. Tags for the 0 h (steady-state) replicates were averaged. (B) Fitted exponential degradation curves, shown for the same isoforms as in A. An additional normalization factor not considered here was used to correct for the slight decrease in total mRNA at later time points, resulting in slightly lower final half-lives of 0.52 h (proximal) and 1.20 h (distal). (C) Correlation between gene-based half-lives determined in 3T3 cells (2P-seq) with previous results in mouse embryonic stem cells (Sharova et al. 2009). (D) Correspondence between our measured half-lives and mRNA half-lives predicted using a model trained on a separate 50% of our data. For each gene with multiple tandem 3′ UTRs, only the most proximal isoform was used to quantitate gene half-life, although results were similar when averaging over all isoforms or using only the most distal isoform. (E) The correspondence between mRNA half-life and ORF exon-junction density. A maximum of 0.02 exons/bp was used for ORF exon-junction density, affecting seven of the 7028 genes. (F) Sequence features used to predict half-lives, arranged in approximate order of importance in the model. Adding more features resulted in diminishing returns, with a model including only the top three to six features performing nearly as well as any of the models with more features. Because of significant multicollinearity, features correlating well were grouped together (e.g., ORF length and ORF exon-junction density) with their pairwise correlation indicated (Pearson r). Also reported are each individual R2 with mRNA stability, and each cumulative R2 calculated for a linear model including all previous features. Predicted targeting for the top 10 miRNAs or for individual miRNAs was quantified using context scores (Grimson et al. 2007; Garcia et al. 2011). Error bars show 95% confidence intervals.


