
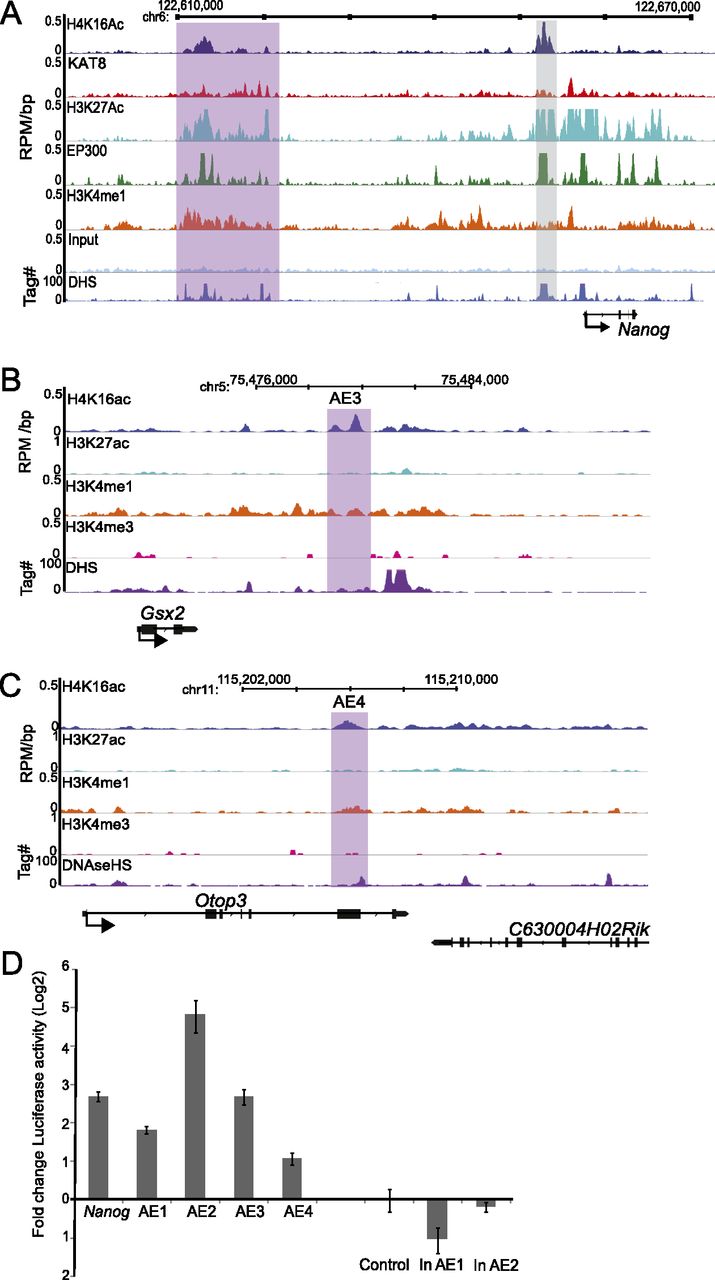
H4K16ac peaks have enhancer activity. (A) H4K16ac/KAT8/H3K27ac/EP300/H3K4me1/input and DHS profiles from ES cells in the 5′ regulatory region upstream of Nanog. ChIP data are shown as RPM per base pair (bp) in 200-bp sliding windows with a 20-bp step. DHS sites are shown as tag density in a 150-bp window with a 20-bp step. Gray-shaded box indicates a genetically defined Nanog enhancer that is used for luciferase assay. (B,C) H4K16ac, H3K27ac, H3K4me1, and H3K4me3 profiles across enhancer downstream from (B) Gsx2 gene (AE3) and (C) in an intragenic region of Otop3 (AE4). ChIP data are shown as RPM per base pair (bp) in 200-bp sliding windows with a 20-bp step. DHS sites are shown as tag density in a 150-bp window with a 20-bp step. Purple-shaded areas correspond to regulatory regions with H4K16ac peaks but not H3K27ac, and these regions were cloned for enhancer reporter assay (D). (D) Enhancer reporter assay for genetically defined enhancer of Nanog (Nanog), and randomly chosen active enhancers based on H3K4me1 and H4K16ac peaks but not H3K27ac peaks (AE1–AE4). Regions with putative inactive enhancers containing H3K4me1 peaks, but neither H3K27ac nor H4K16ac (in AE1, in AE2) were also assayed. Empty vector pGL4.26 (Control) served as a negative control. Firefly luciferase activity was normalized to transfection efficiency with Renilla luciferase activity using pRL-TK, log2 fold change in luciferase activity was plotted with error bars showing standard error of mean from two biological and eight technical replicates (n = 8).


