
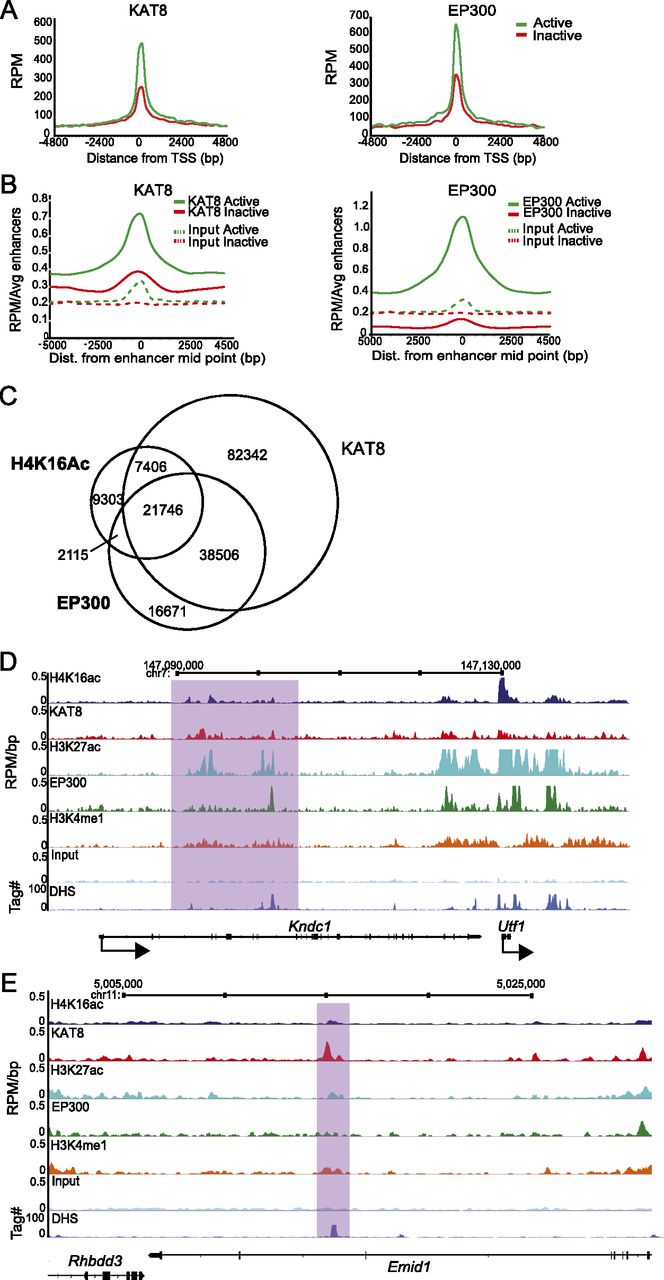
KAT8 is found on active enhancers. (A) RPM cross-linked ChIP-seq tag counts from ESCs around (±5 kb) the TSS and TES of active (green) and inactive (red) genes for KAT8 (left) and EP300 (right). (B) Average RPM per enhancer tag counts around the enhancer midpoint of active (H3K4me1+/H3K27ac+) or inactive enhancers for KAT8 (left) or EP300 (right) ChIP-seq (solid lines) or for input DNAs (dotted lines). (C) Quantification of SICER defined H4K16ac, KAT8, and EP300 peak overlap. Venn diagrams from left to right illustrate number of peaks overlapping between H4K16ac/KAT8, H4K16ac/EP300, and KAT8/EP300, respectively. (D) H4K16ac/KAT8/EP300/H3K27ac/ H3K4me1/ and H3K4me3 ChIP profiles from ESCs around the Kndc1-Utf1 locus. Data are shown as RPM per base pair (bp) in 200-bp sliding windows with a 20-bp step. Purple-shaded boxes indicate regions where the KAT8 distribution more closely mirrors that of H3K27ac than does EP300. (E) H4K16ac/KAT8/H3K27ac/EP300/H3K4me1/input and DHS profiles from ESCs across a potentially H4K16ac-specific active enhancer in the Emid1 locus. The peak of H4K16ac and KAT8 (purple-shaded area) corresponds to a strong DHS and a peak of H3K4me1, but not of EP300/H3K27ac.


