
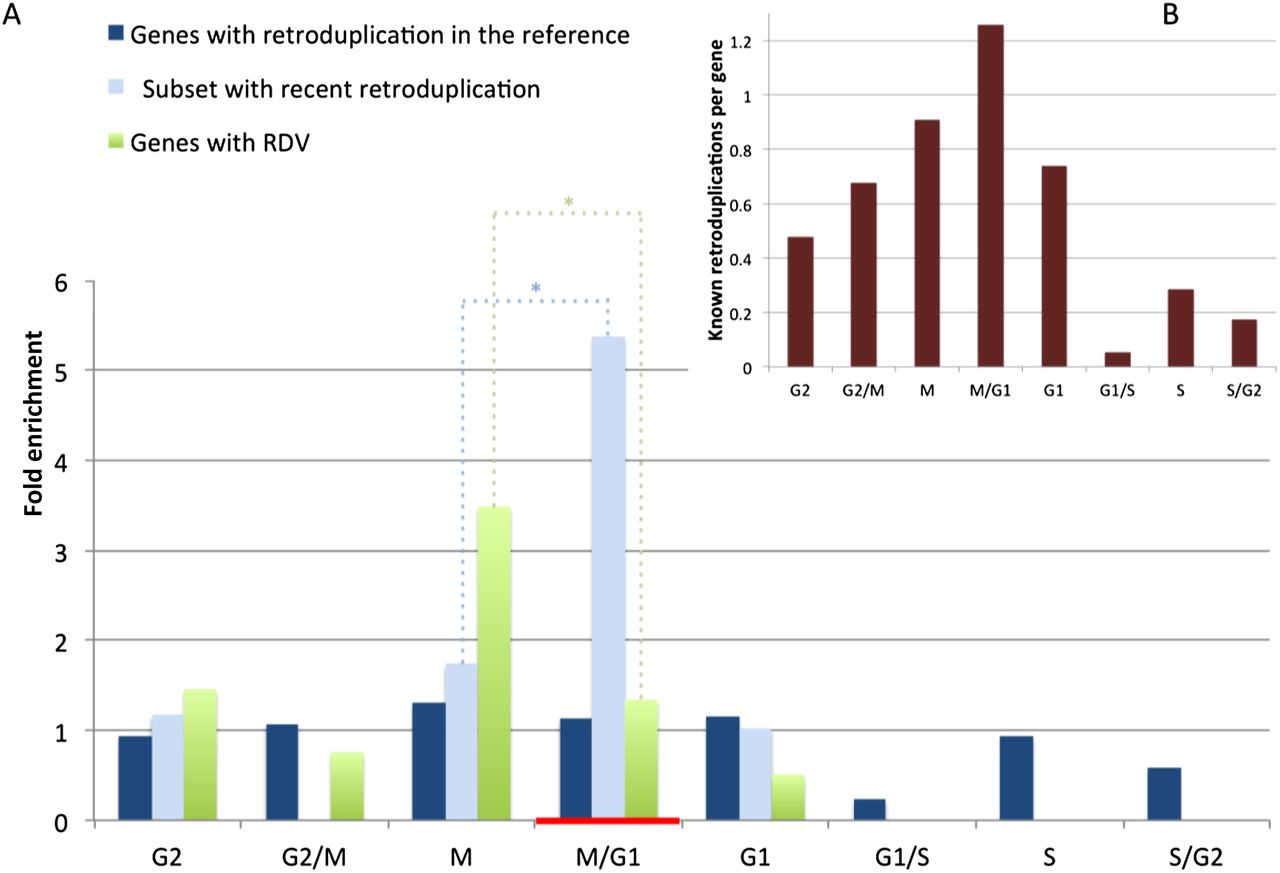
Enrichment of parent genes for expression at different phases of the cell cycle. A list of periodic genes was produced previously (Whitfield et al. 2002) and downloaded from Cyclebase (Gauthier et al. 2010). (A) Genes with RDVs and recent retroduplication in the reference genome are significantly enriched (with P-values = 0.012 and 0.008, respectively, and denoted by [*]), for expression in the M and M/G1 cell cycle phases. M/G1 represents genes with uncertain phase assignment close to the M-to-G1 transition due to measurement imprecision. During M/G1, cell division occurs (red horizontal bar). Due to the saturation effect (see text), the enrichment for parent genes being expressed during M or M/G1 is not obvious when analyzing all known retroduplications. (B) Average number of retroduplications in the reference genome per gene (y-axis) is depicted for periodic genes with maximum expression at particular cell cycle phases (x-axis). Genes expressed in M and M/G1 phases generate significantly more (P-value = 0.0047) retroduplications than genes expressed during other phases, suggesting that cell cycle timing directly relates to retroduplication frequency.


