
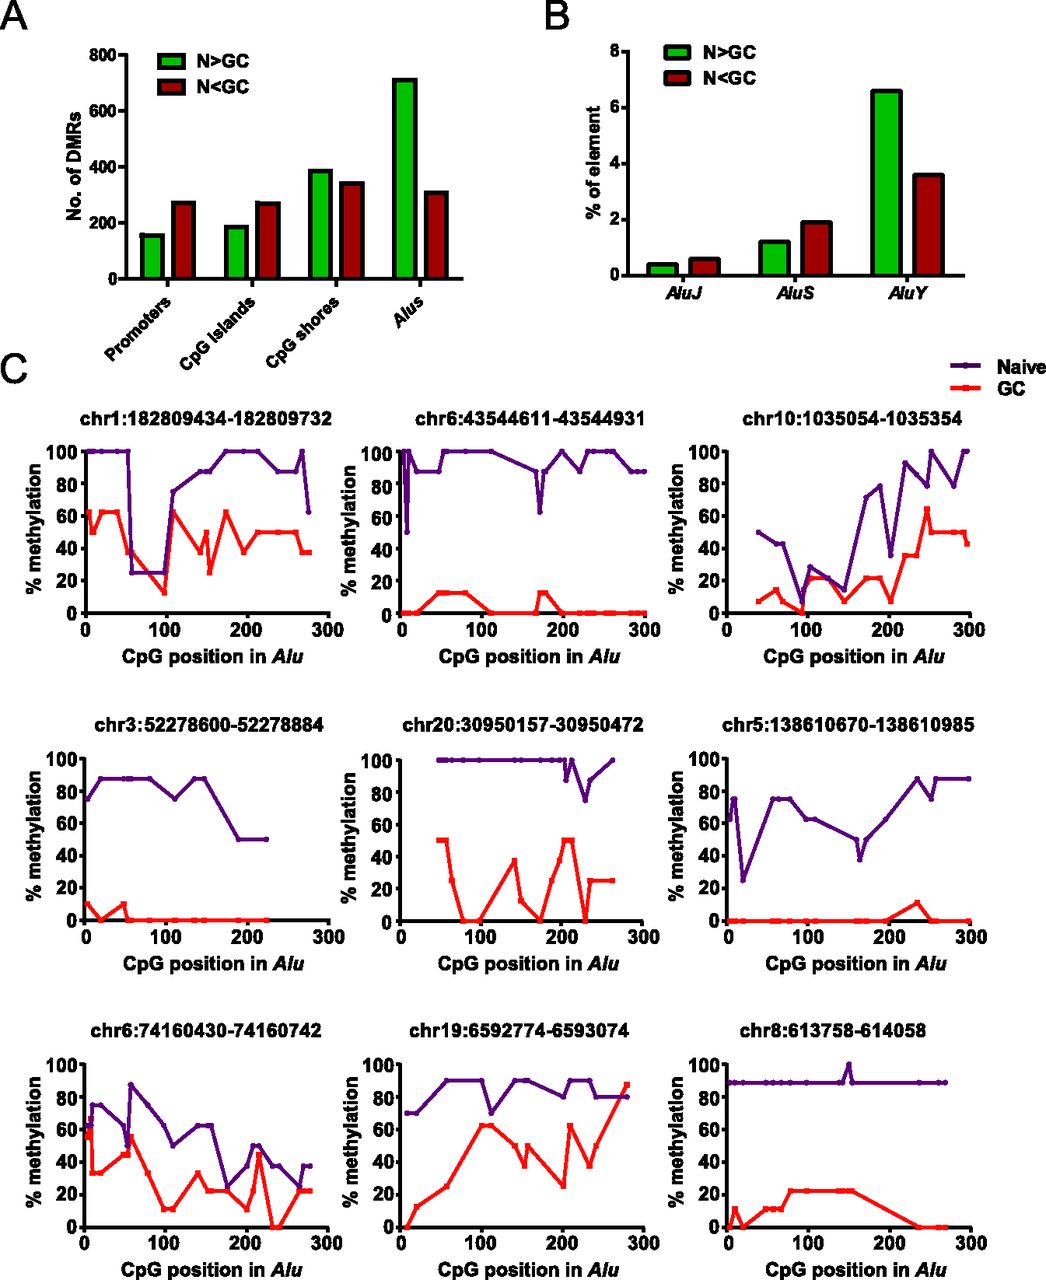
Widespread loss of DNA methylation at Alu elements in GC B cells. (A) Distribution of DMRs between naive and GC B cells at various genomic features (for definition of each genomic feature, see Methods). The bar graph illustrates the number of loss-of-methylation DMRs (naive > GC) in green and gain-of-methylation DMRs (naive < GC) in red that overlap with the indicated genomic feature. (B) Percentage of elements within each Alu subfamily (J, S, and Y) with loss (N > GC) or gain (N < GC) of methylation in GC compared to naive B cells by MIRA-seq analysis. (C) Validation of differentially methylated Alu elements in naive and GC B-cell populations by genomic bisulfite sequencing. The methylation status of CpGs across nine Alu elements was analyzed. After bisulfite treatment and PCR amplification of the Alus, at least eight individual clones of the PCR product were analyzed. The percentage of methylated cytosine (y-axis) was calculated at individual CpG positions relative to the 5′ end of each Alu element (x-axis). The genomic location (hg19) of the Alu elements analyzed are listed above each graph.


