
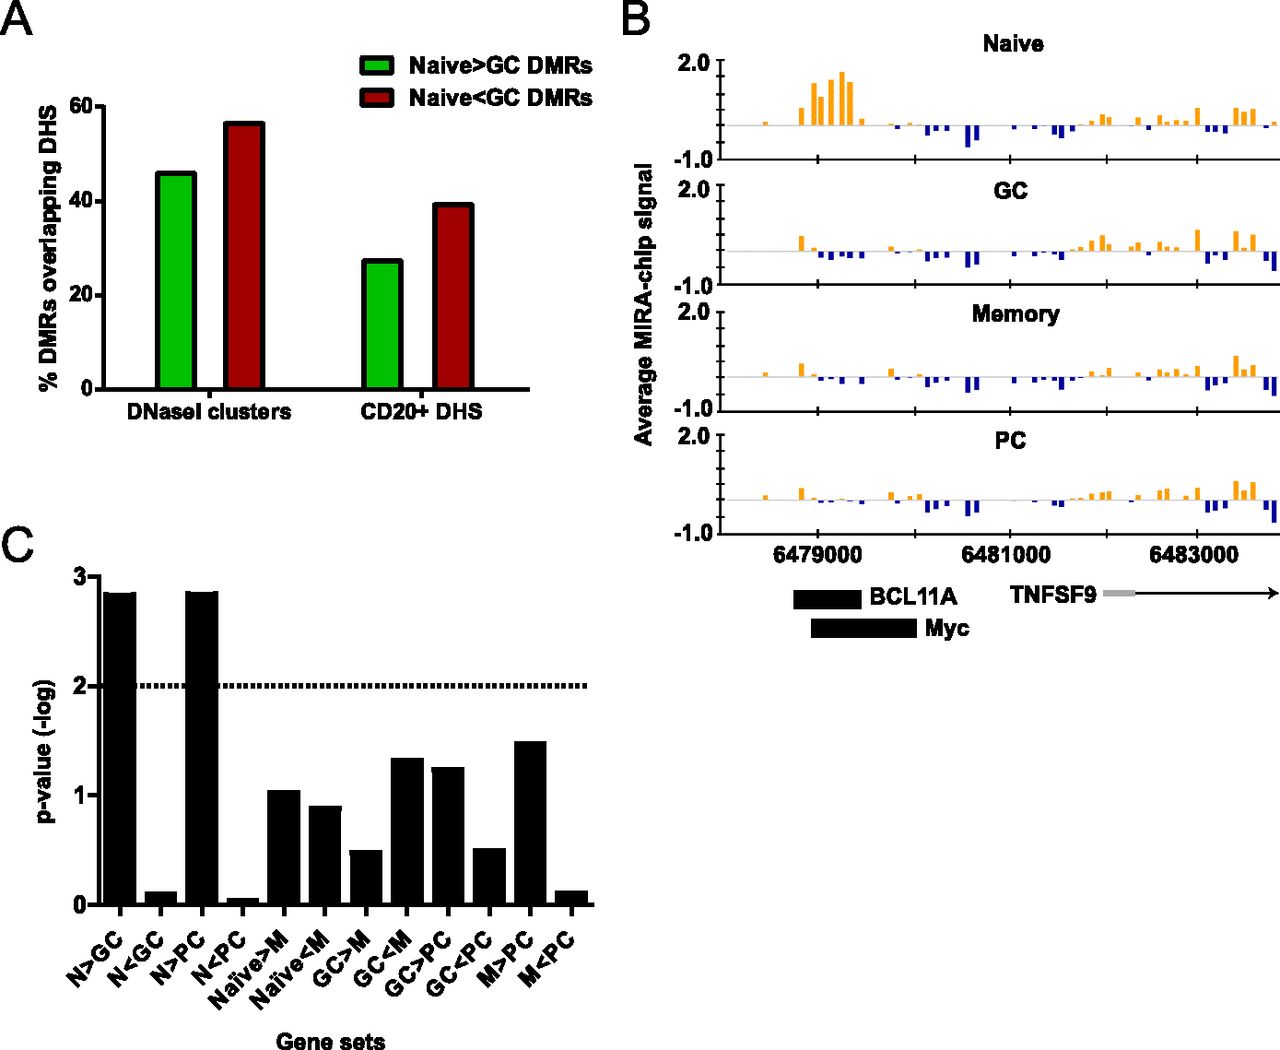
Activation-induced DMRs reveal cis-regulatory elements in GC B cells. (A) Overlap of DMRs with DNase I hypersensitive sites (DHSs). The percentage of loss-of-methylation (N > GC) or gain-of-methylation (N < GC) DMRs intersecting DNase I clusters from any cell type or DHS from primary CD20+ B cells is shown. (B) Example of a DMR overlapping a DNase I HS as well as MYC and BCL11A binding sites in a lymphoblastoid cell line. The bar graphs display the average MIRA-chip signals from eight biological replicates in naive, GC, memory, and PC cells at the genomic region on chromosome 19, as indicated on the x-axis. The location of an annotated gene (TNFSF9) is shown below the bar graphs relative to the genomic coordinates on chromosome 19, and the orientation of the arrow indicates the direction of transcription. Black rectangles below the plots indicate the location of MYC and BCL11A binding sites determined by ChIP-seq data from the GM12878 lymphoblastoid cell line (performed by Iyer's group at University of Texas-Austin and Myer's group at HudsonAlpha, respectively) as determined by the ENCODE project (The ENCODE Project Consortium 2011). (C) Analysis of the association between DNA methylation and gene expression changes by GSEA. The –log of enrichment P-value for each gene set (differentially expressed genes in each pair of cell types) is shown. Gene sets with –log of P-value above the dotted line (>2 or P < 0.01) are considered to be statistically significant.


