
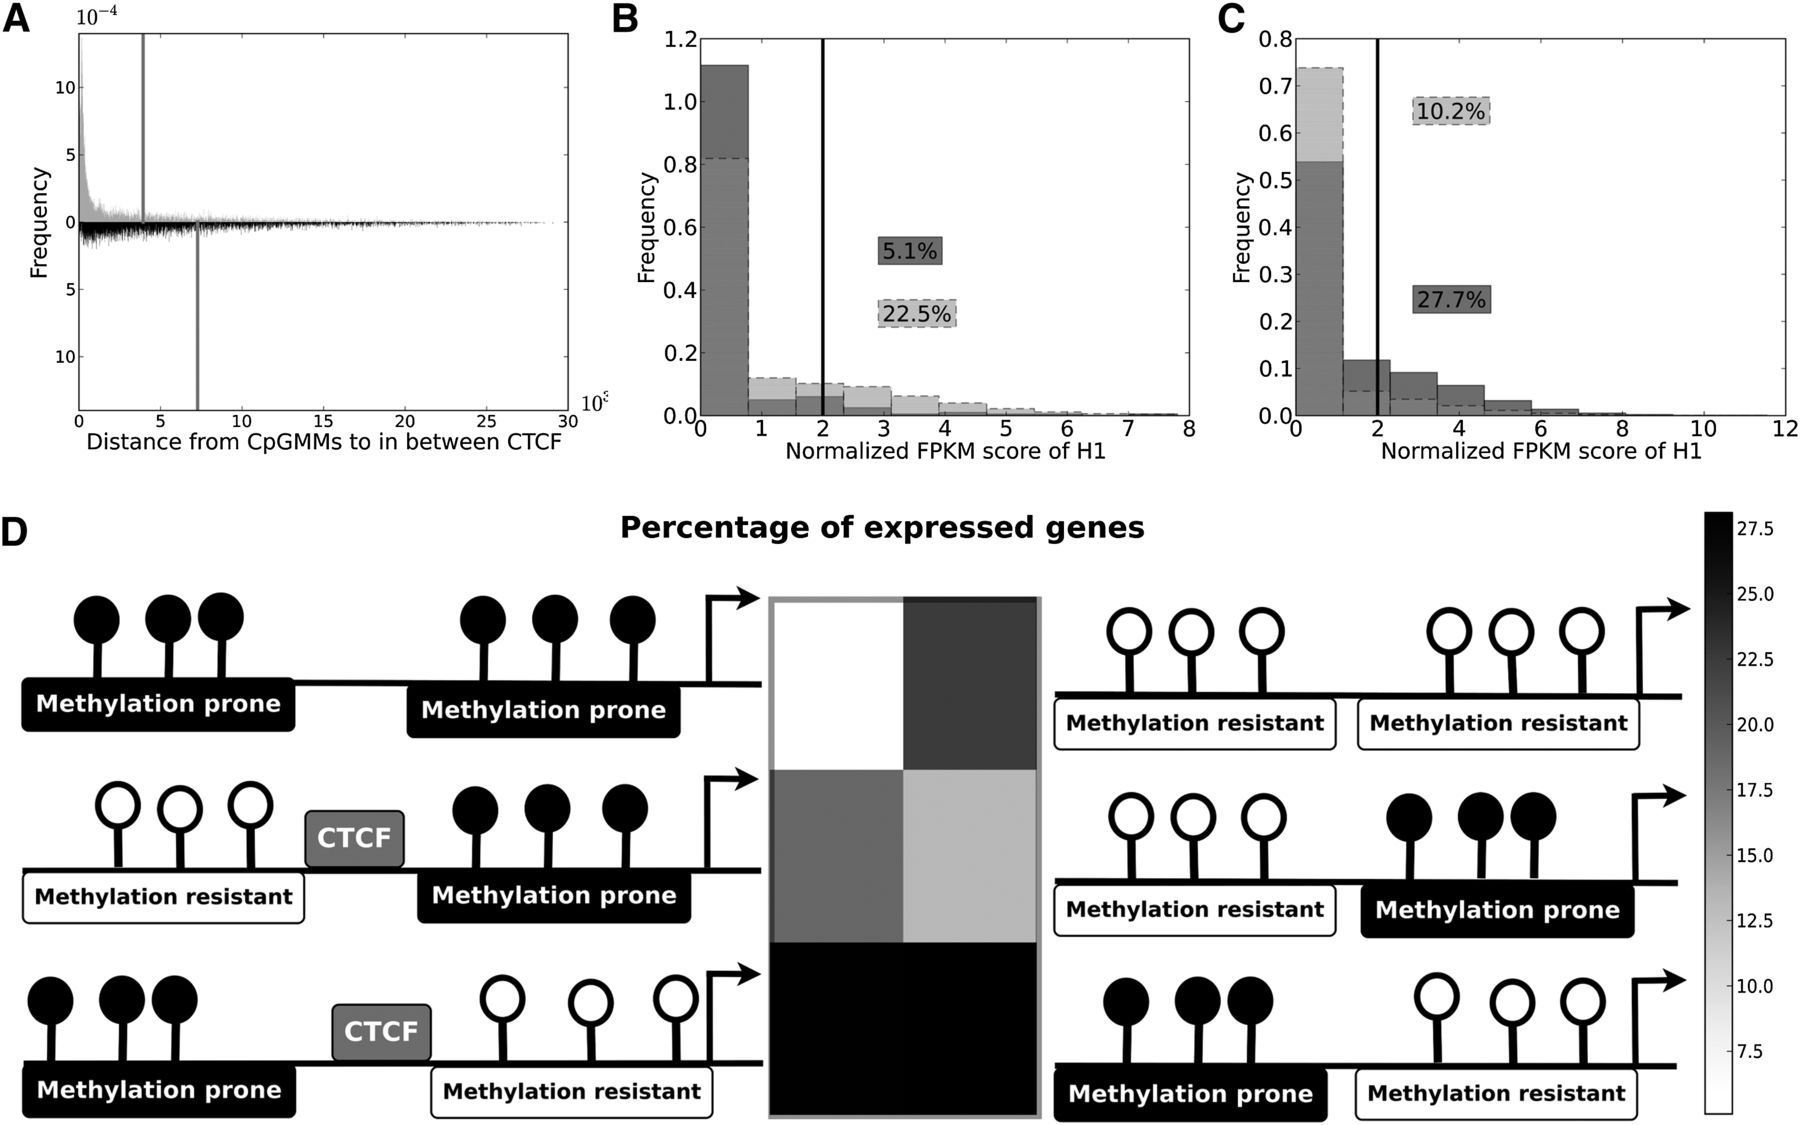
Discriminative features of mixed promoters containing bivalent and monovalent CpGMMs in ES cells. (A) Histograms of the distances of methylation-resistant CpGMM targets (gray), and methylation-prone CpGMM targets (black), to the in-between CTCF for promoters simultaneously containing methylation-resistant and methylation-prone CpGMMs. The vertical lines show mean values of the distances to CTCF of methylation-resistant and methylation-prone CpGMM loci. (B) Histogram of the expression of genes with only methylation-resistant (light gray) and methylation-prone (gray) CpGMMs. (C) Histogram of the expression of all genes (light gray) and genes with promoters simultaneously containing methylation-resistant and methylation-prone CpGMMs (gray). The black vertical lines show the gene expression threshold. The numbers inside boxes are the percentages of expressed genes. (D) Heatmap of the percentage of expressed genes with mixed and unmixed structures of methylation-resistant and methylation-prone CpGMMs 1kb upstream of the TSS. The corresponding genomic structure with positions relative to the TSS (marked with an arrow) of the methylation-resistant and methylation-prone CpGMMs and CTCF binding is represented beside each heatmap cell.


