
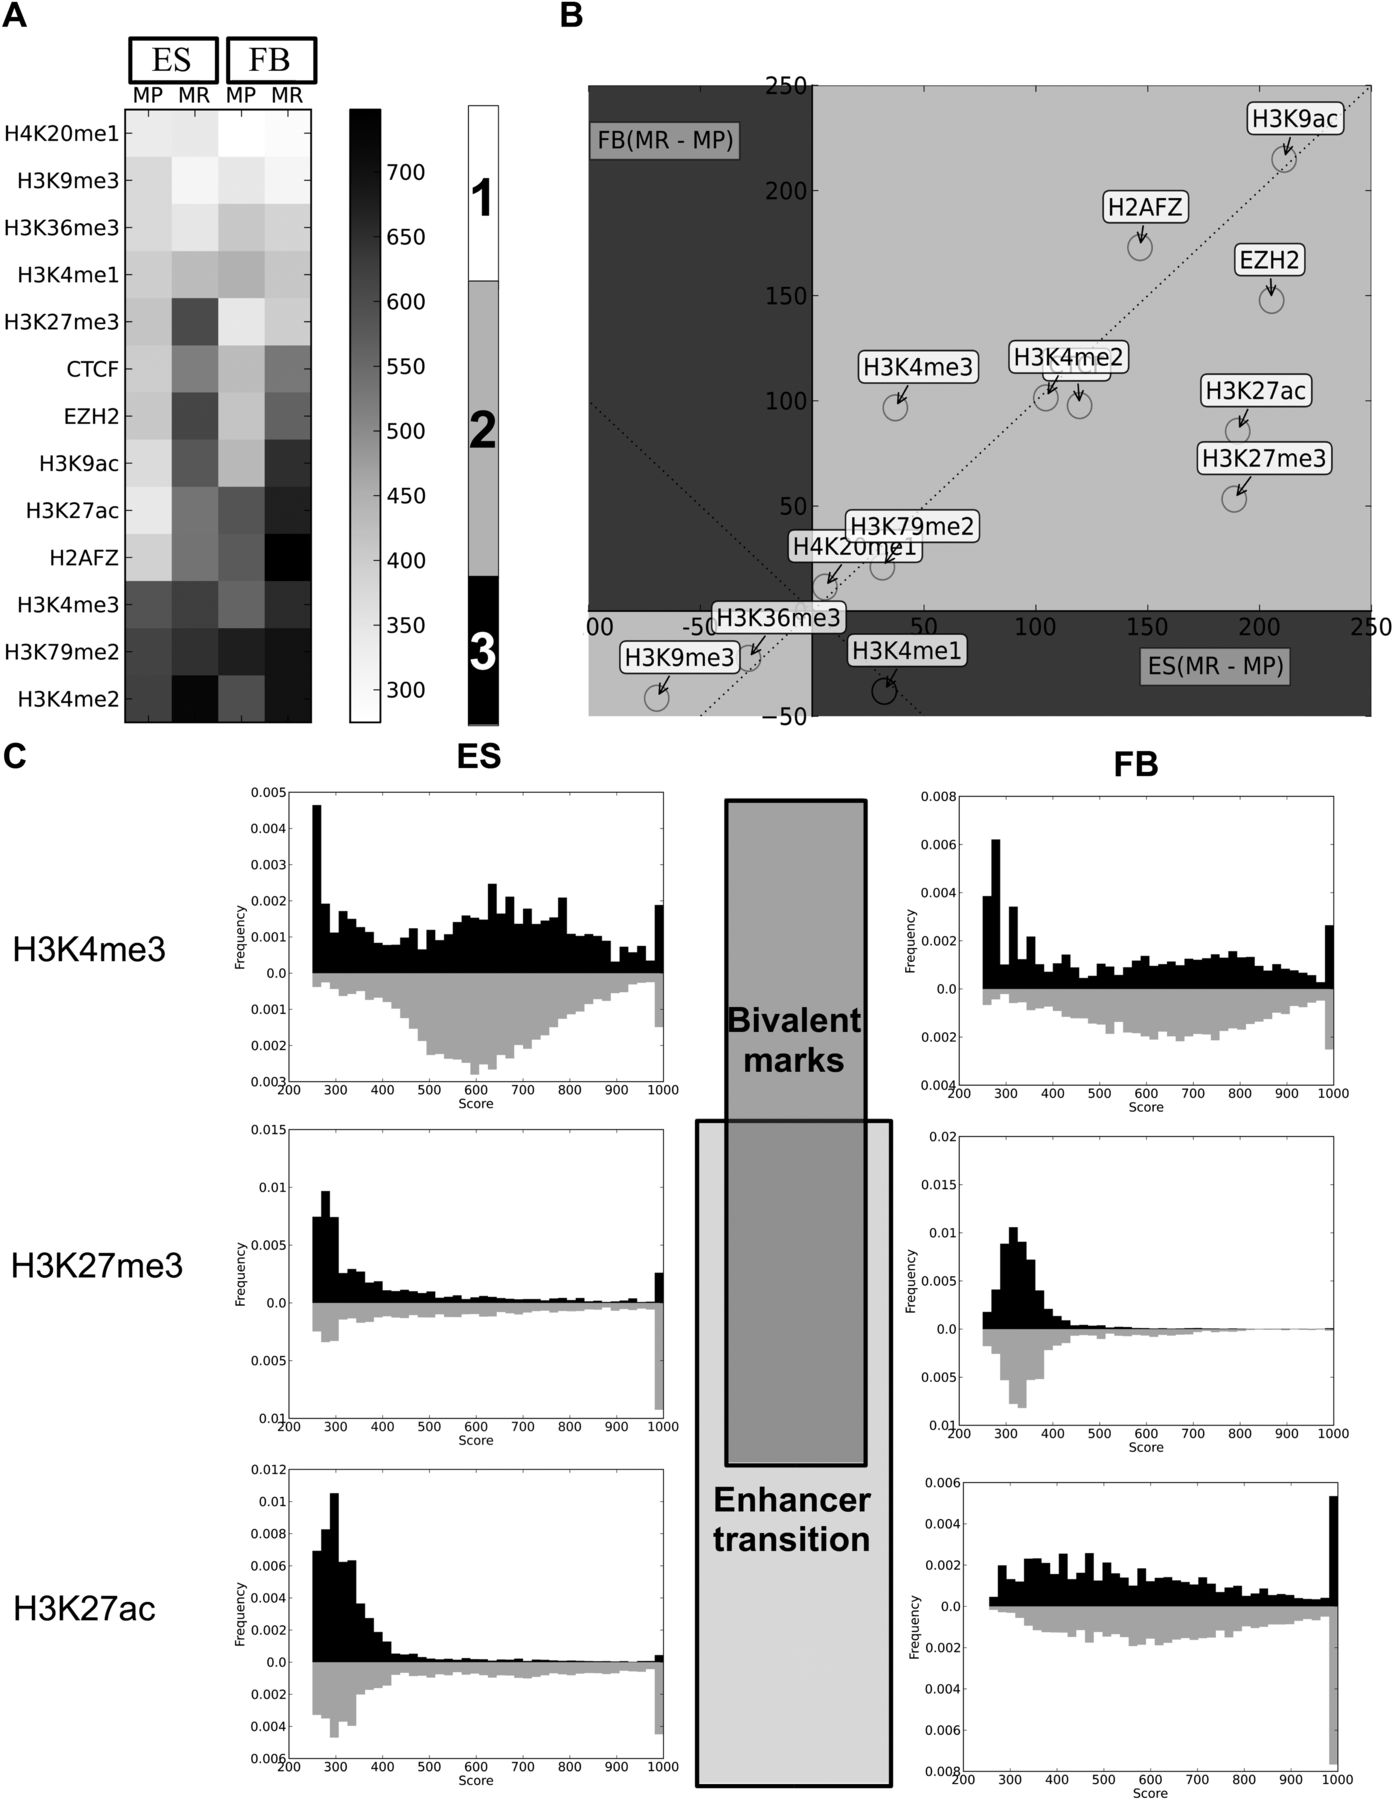
Correlation between ES cell CpGMM loci targets and histone mark signals. (A) Heatmap of the mean signal of the co-occurrences of histone marks with methylation-prone (MP) and methylation-resistant (MR) ES cell CpGMM targets that share loci (calculated as in Supplemental Fig. S6) with ES and fibroblast histone marks. The labeled rectangles mark the three types of correlation patterns. The gray color bar shows the color codification of the mean signal. (B) Scatter plot of the differences of resistant minus prone averages of histone mark signals' co-occurrences with ES cell CpGMM targets in fibroblasts versus ES cells. (C) Histograms of CpGMM targets co-occurring with the H3K4me3, H3K27me3, and H3K27ac histone marks. Only the signals with a score of at least 250 are plotted. The frequencies associated with methylation-resistant and methylation-prone CpGMM targets are in gray and black, respectively.


