
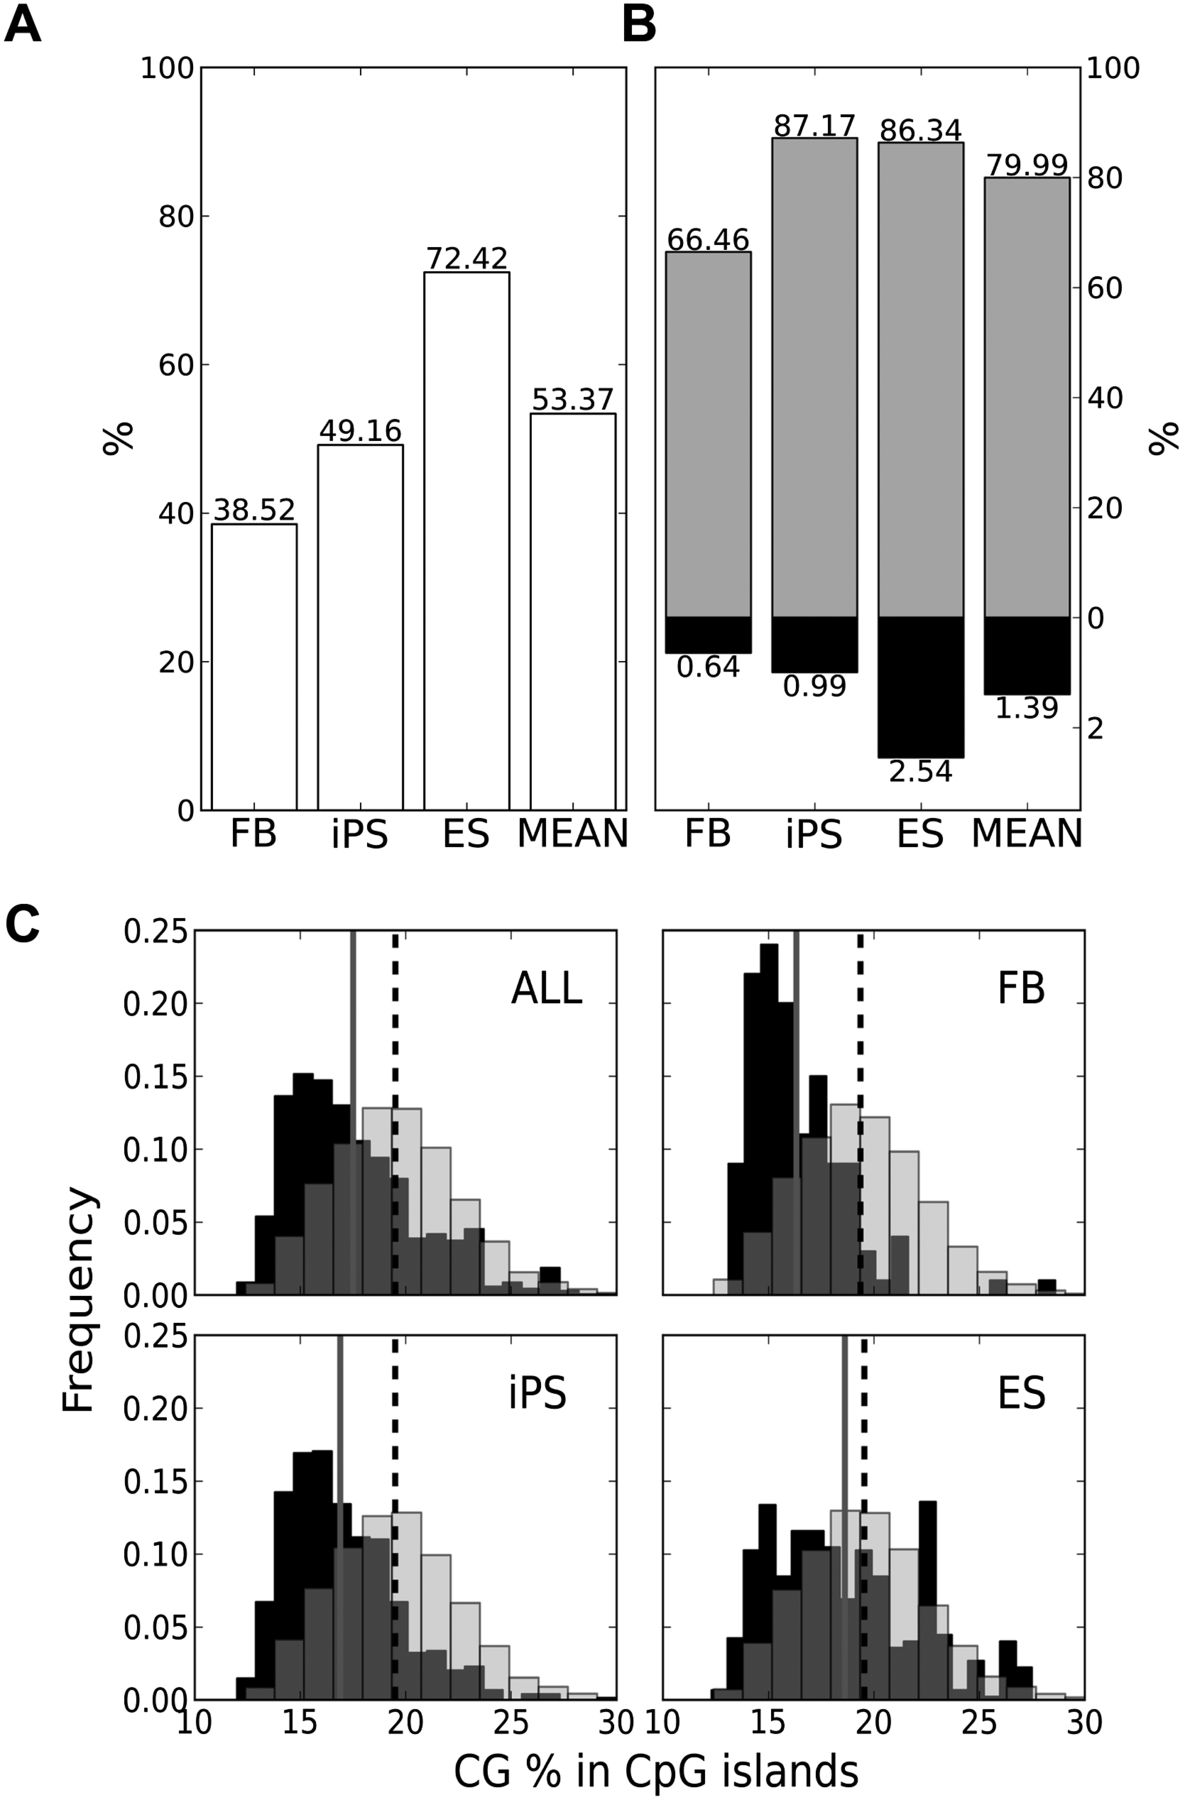
Correlation of methylation-resistant and methylation-prone CpGMM targets with CpG islands for each cell type. Percentage of CpGMM targets of each cell type that lie inside CpG islands (A) and methylation-resistant and methylation-prone CpGMM targets of each cell type that lie inside CpG islands (B). The methylation-resistant percentages are in gray, the methylation-prone in black, and the merged ones in white. The rightmost bars correspond to the mean across all the populations. (C) Histograms of the CG content of the CpGMM targets inside CpG islands for the pool of all samples (ALL), fibroblast (FB), iPS, and ES. The dashed and gray vertical lines mark the positions of the mean of the methylation-resistant and methylation-prone distributions, respectively.


