
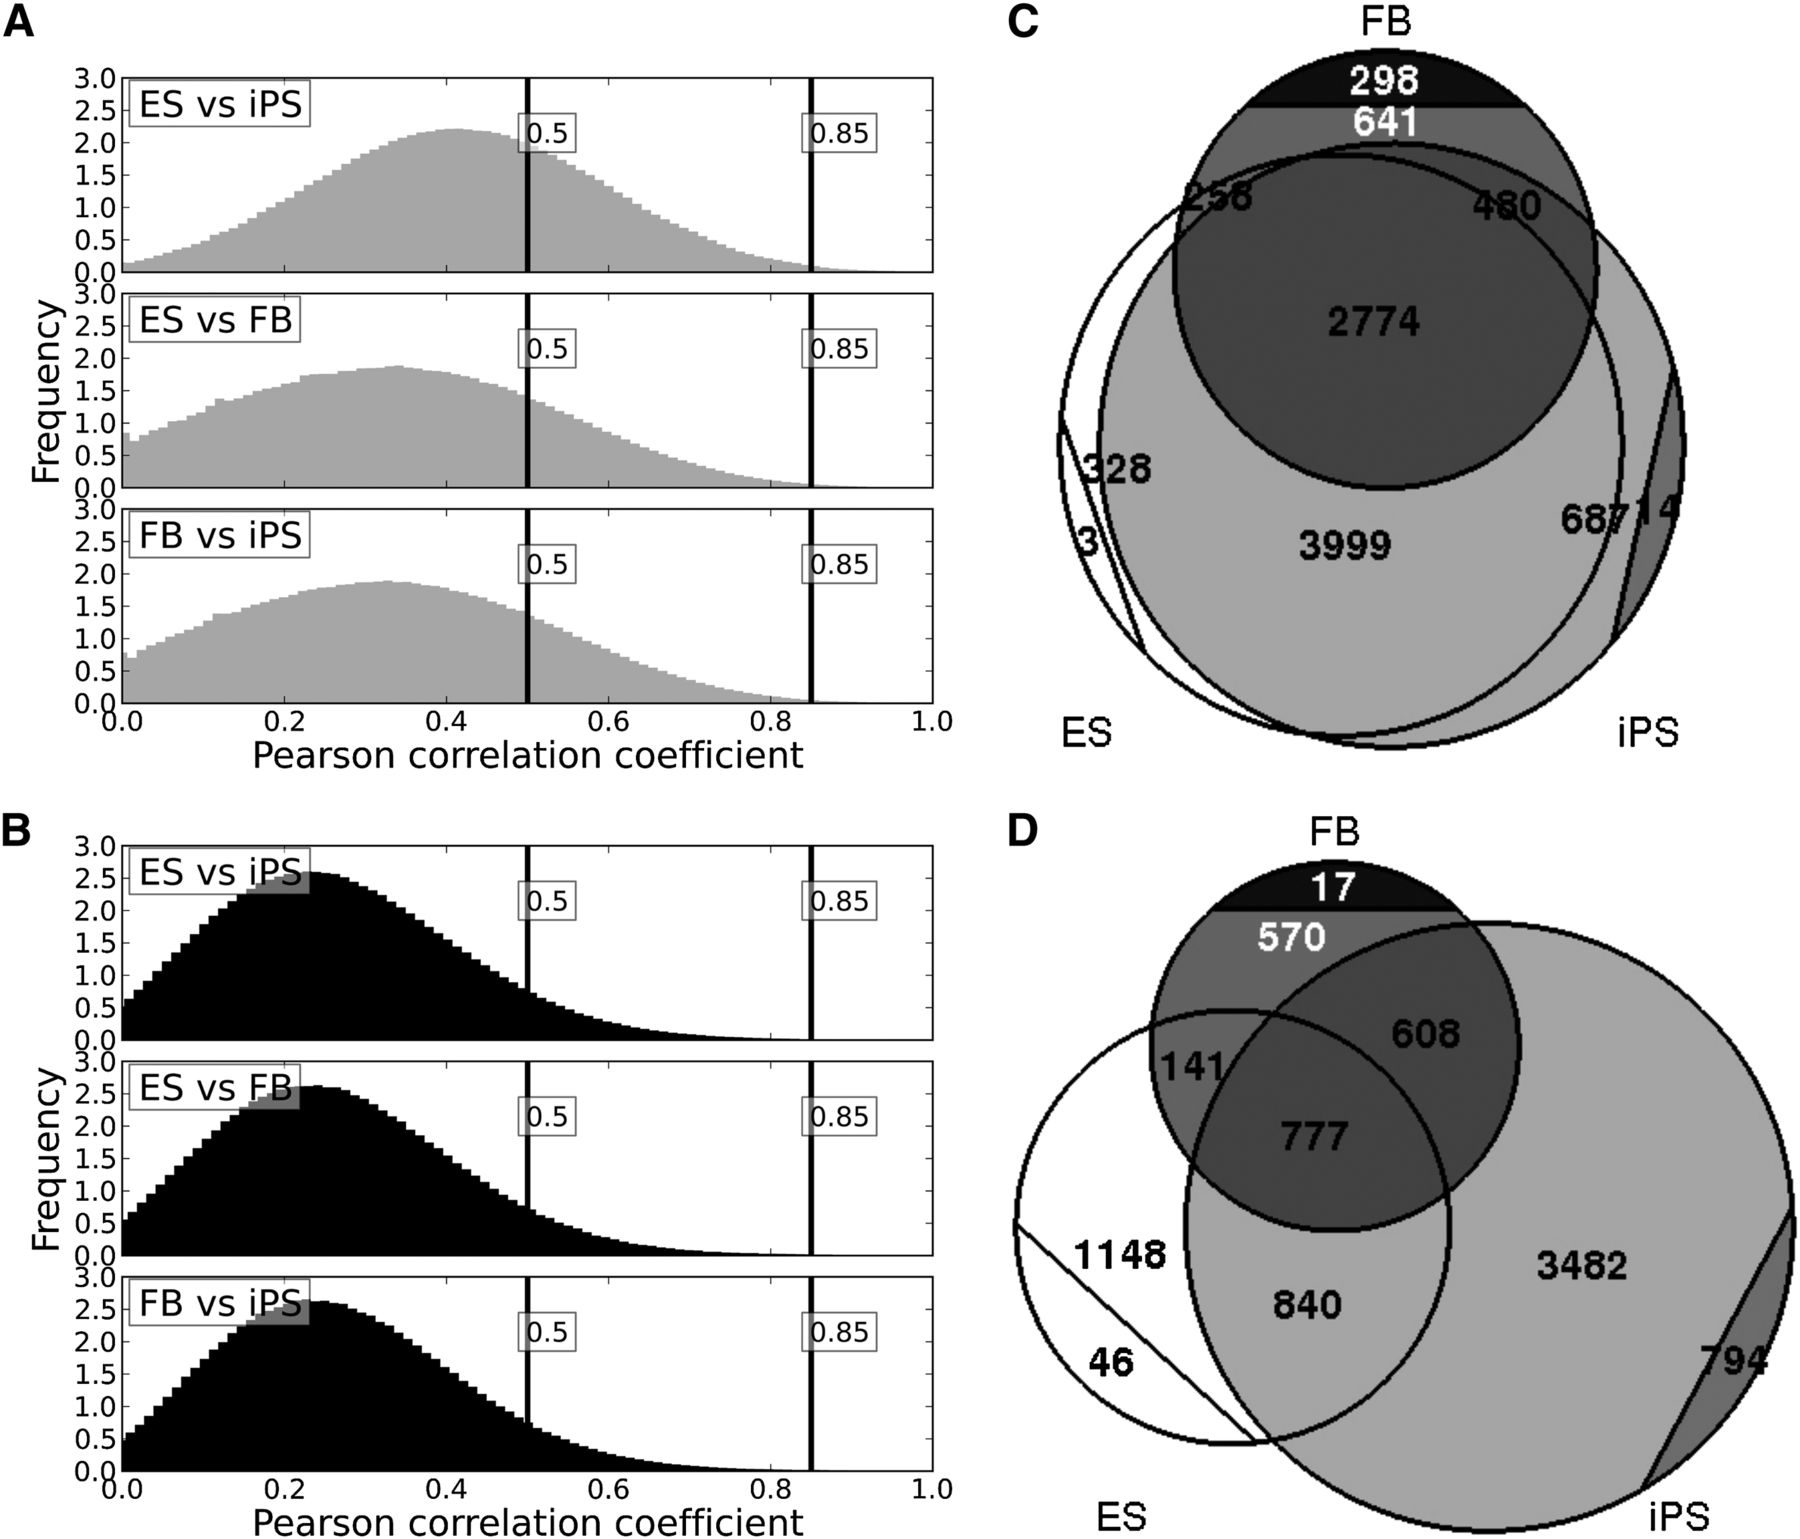
Figure 2.
Methylation-resistant CpGMMs are more abundant and are highly correlated among pluripotent populations. Histograms of the Pearson correlation coefficients of pairwise pools of different cell types for methylation-resistant (A) and methylation-prone (B) CpGMMs. Vertical lines mark the low and high correlation boundaries. Venn diagram of the numbers of methylation-resistant (C) and methylation-prone (D) CpGMM clusters in each cell type. ES CpGMM regions are marked in white, iPSs in gray, and fibroblasts in black. The numbers enclosed by the circular segments are the numbers of cell type-specific motifs.


