
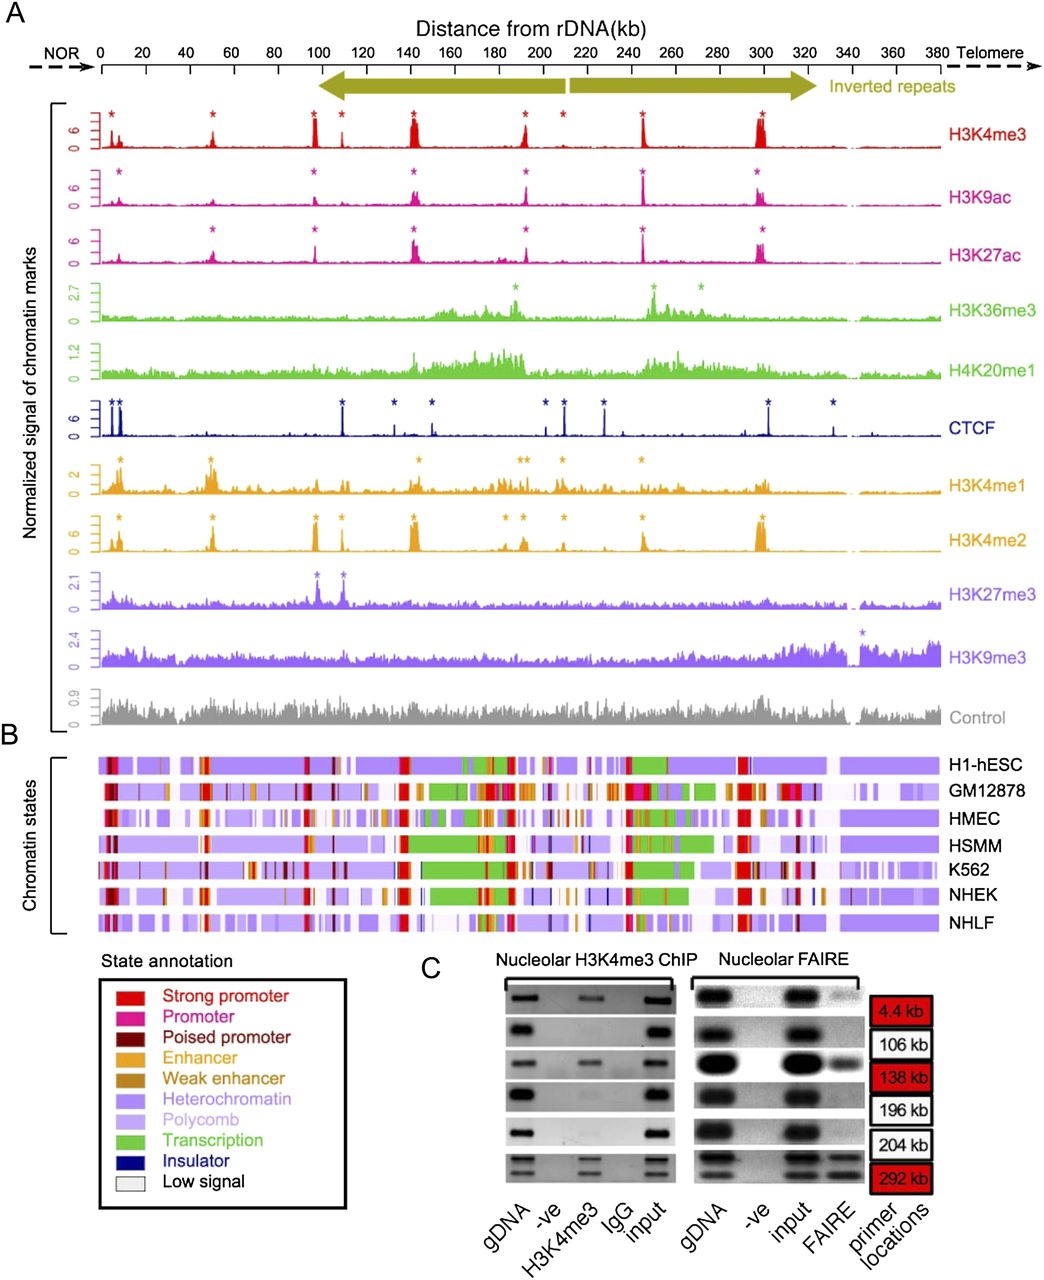
Chromatin landscape of the DJ. (A) ChIP-seq signals of different chromatin features (right) in H1-hESC cells, normalized to tags per million mapped reads are shown below a schematic of the DJ, including inverted repeats. Asterisks indicate enrichment sites. (Bottom) Control signal is shown in gray. (B) Chromatin states derived from the multivariate HMM analysis for seven different cell types (right). Each colored bar represents a specific chromatin state, as annotated below left. (C) Nucleolar H3K4me3 ChIP-PCR and nucleolar FAIRE-PCR using HT1080 cells validate the presence of H3K4me3 and FAIRE in the DJ. DJ positions of the primers used are shown to the right, and red boxes correspond to peaks of H3K4me3 from A. Genomic DNA (gDNA), input and negative controls (-ve and IgG) are shown.


