
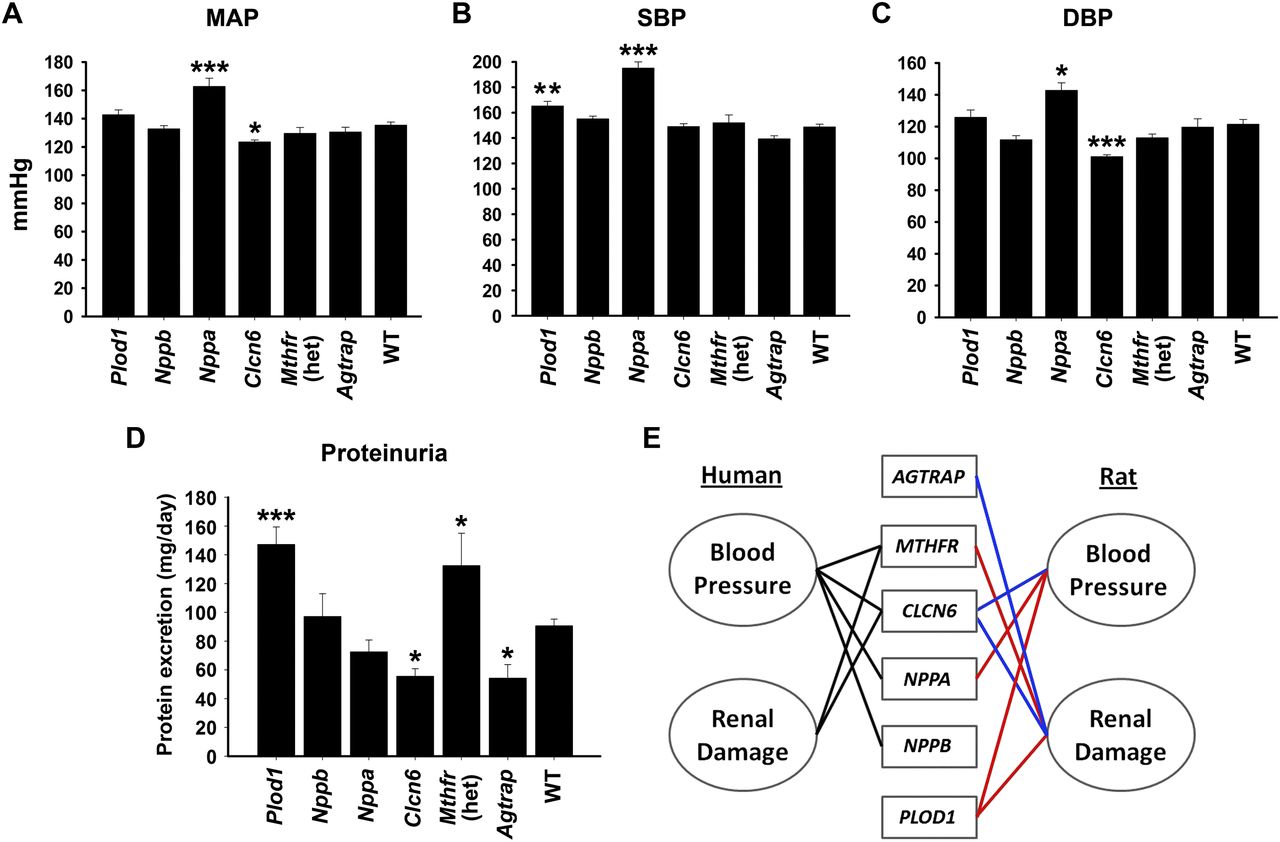
Mean arterial pressure (MAP) (A), systolic blood pressure (SBP) (B), and diastolic blood pressure (DBP) (C) measured by radiotelemetry in conscious WT and mutant SS rat strains on 4% NaCl diet (n = 8–25 per strain). Data are presented as mean BP ± SEM. (*) P < 0.05, (**) P < 0.01, and (***) P < 0.001 vs. WT as determined by one-way ANOVA followed by a Holm-Sidak post-hoc test. (D) Rats were placed in metabolic cages overnight to acclimate, followed by a 24-h urine collection. Data are presented as mean protein excretion ± SEM (n = 8–25 rats per strain). (*) P < 0.05 and (***) P < 0.001 vs. WT as determined by one-way ANOVA followed by a Holm-Sidak post-hoc test. (E) BP and renal damage are linked with multiple AGTRAP-PLOD1 locus genes in human association studies and mutant SS rat strains. For human, genes were considered linked to a phenotype if an associated SNP or SNPs in LD (r2 > 0.6) with an associated SNP caused nonsynonymous mutations or were significantly associated with expression of a gene. Blue lines indicate decreased BP and/or proteinuria associated with a gene in the rat. Red lines indicate increased BP and/or proteinuria associated with a gene in the rat.


