
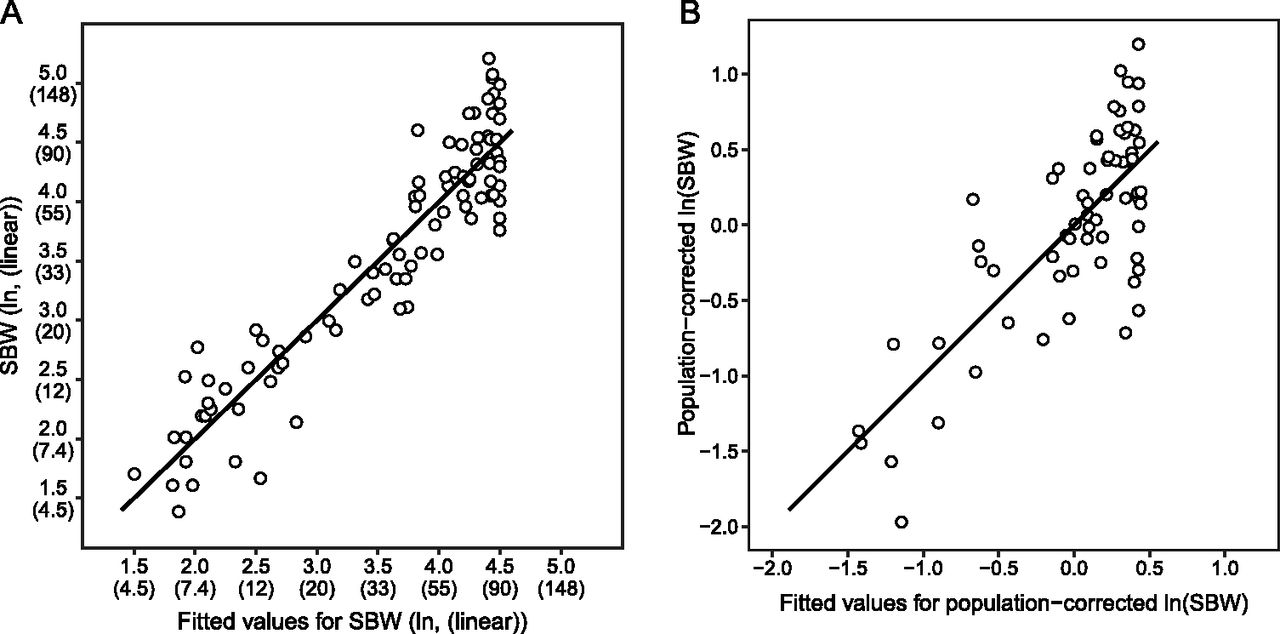
Allele frequencies at size markers explain 86% of size variation before correction for population structure (A) and 52.5% after (B). (A) A linear model was generated to assess the power of breed-averaged allele frequencies to explain variance in standard breed weights (SBWs). SBWs in lb (in parentheses) were transformed by natural log to approximate a normal distribution as was done in previous studies (Boyko et al. 2010). The black line indicates perfect equality of the fitted values with the SBWs. The cluster of breeds with a fitted weight of 90 lb (40.8 kg) reflects the lack of informativeness of these loci for large breeds. Small amounts of scatter (≤0.05) were added to plotted values to reduce overplotting (n = 93). (B) A correction for population structure was performed by regressing the SBW on breed-averaged, genome-wide principal components (PCs). More than half (52.5%) of the variance in the residuals of this regression, the corrected SBWs (cSBWs), was explained by allele frequencies at the seven size markers. Since PCs were calculated from the CanMap data set, cSBWs could only be calculated for the 65 breeds that were present in both our data set and the CanMap data set.


