
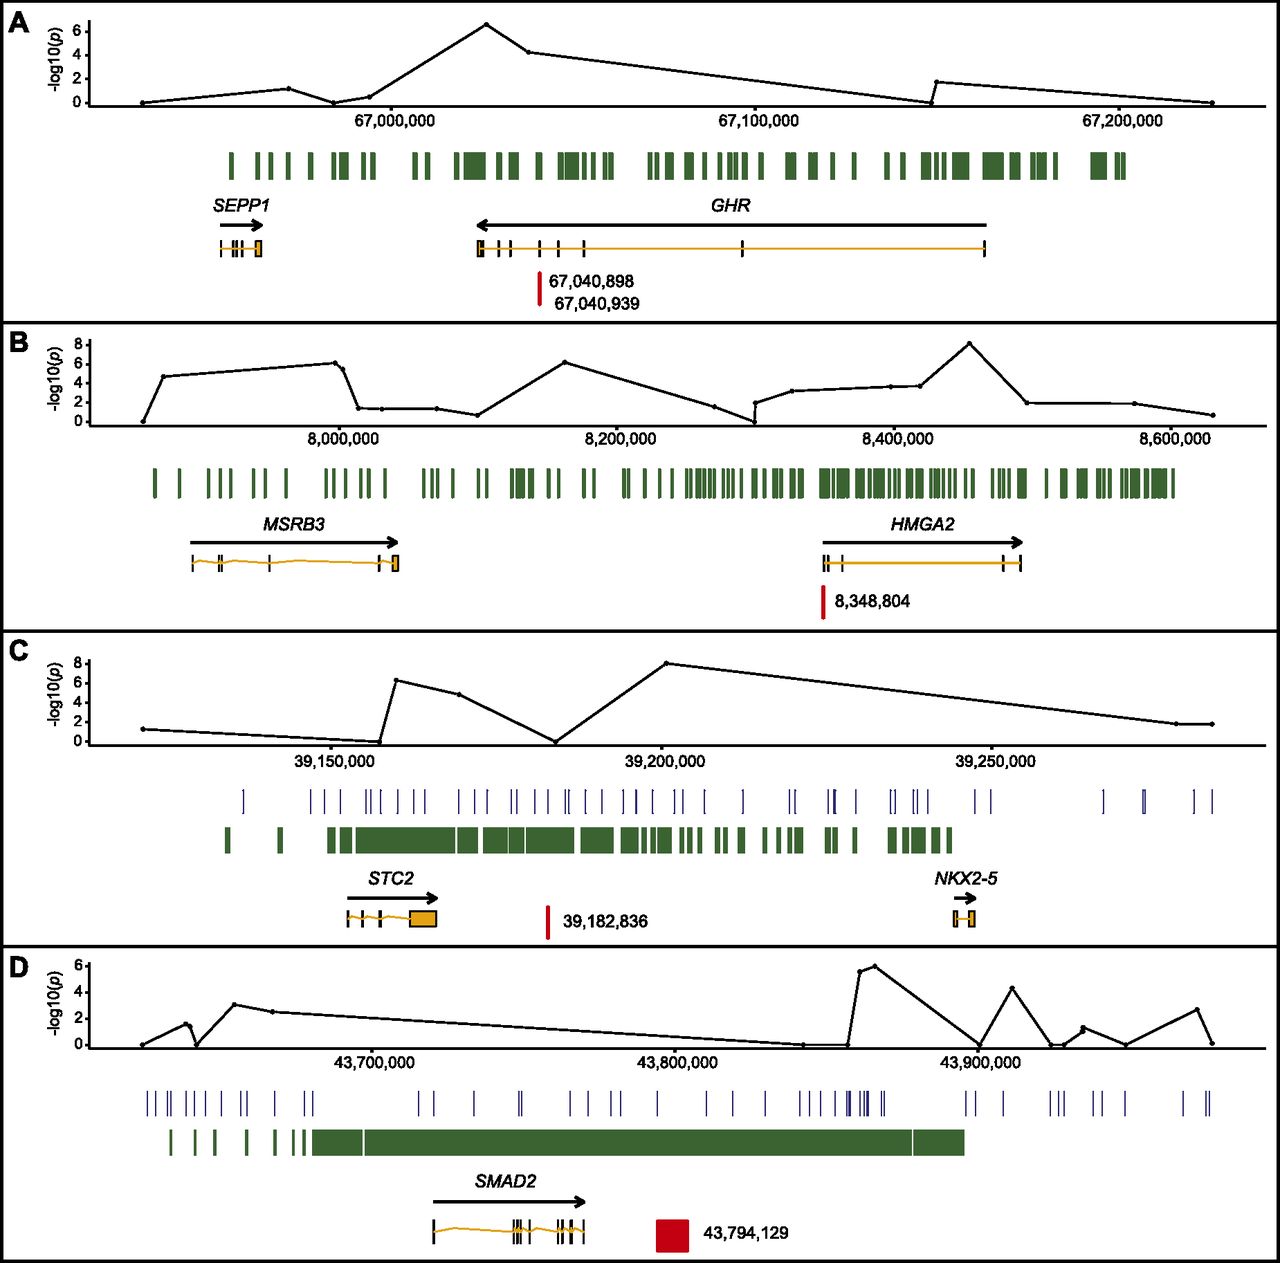
Figure 1.
Fine-mapping of four loci associated with canine body size. (A–D) Regional plots of the four fine-mapped loci: CFA4:67 Mb (A), CFA10:8 Mb (B), CFA4:39 Mb (C), and CFA7:43 Mb (D). Each plot includes the following tracks, from top to bottom: P-values of the genotyped SNPs in the CanMap data set (Boyko et al. 2010) (with coordinates updated to CanFam 3.1 genome assembly); the regions of the genome covered during fine-mapping (green and blue; amplicons for marker discovery and SNP positions for SNPlex, respectively); genes (orange; see Methods for identifiers); and the most highly associated marker(s) identified in each region (red).


