
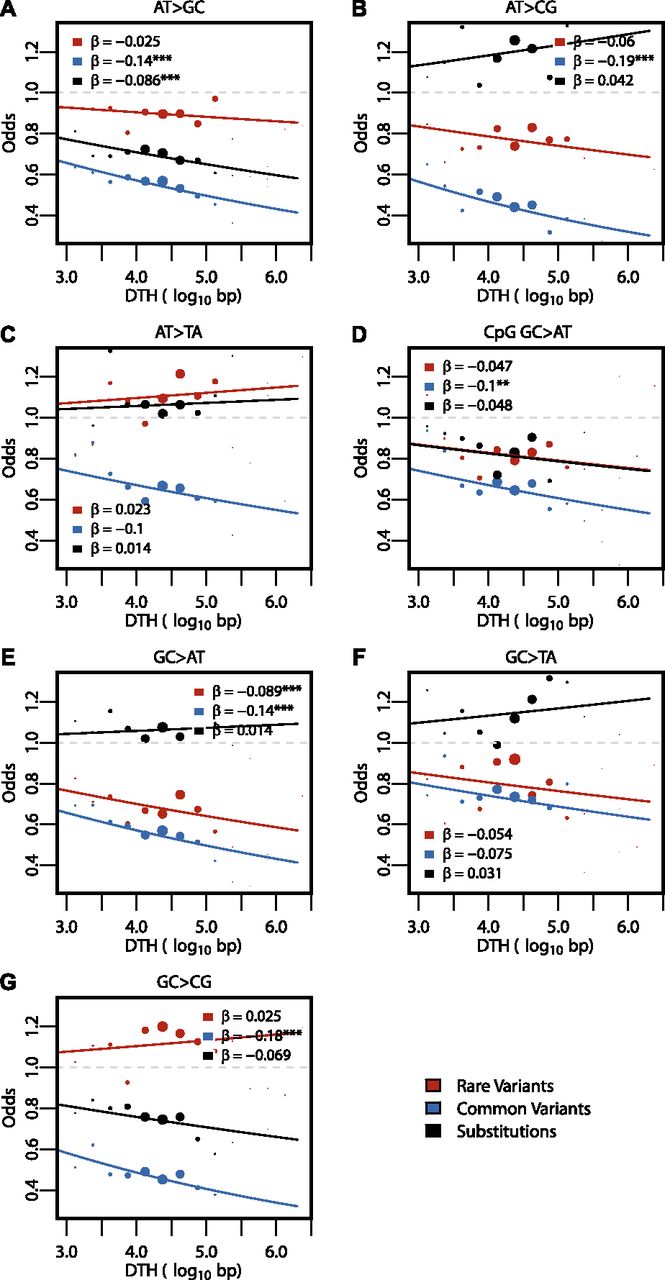
Regression results for DTH across variant subtypes for rare variants, common variants, and substitutions. The relationship
between DTH (log10 bp) and the seven variant subtypes: (A) AT > GC, (B) AT > CG, (C) AT > TA, (D) CpG GC > AT, (E) GC > AT, (F) GC > TA, and (G) GC > CG (plotted as in Fig. 3). Filled points show the conditional variant proportions, scaled by the intercept of the logistic regression. Symbol size
represents the proportion of the given variant subtype falling into a given DTH bin. The solid lines are the fitted logistic
regression curve, where  is the slope fitted in the logistic regression and
  is the DTH in the
  th bin. The gray dashed line represents the baseline of no effect.


