
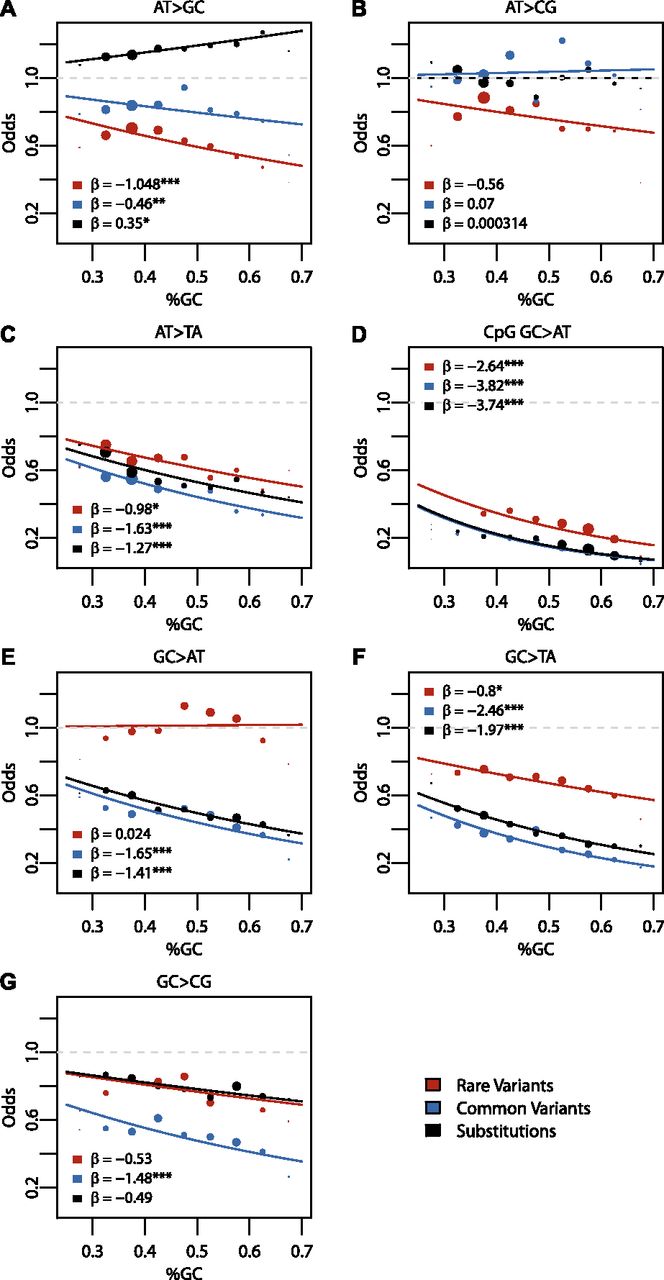
Regression results for GC content across variant subtypes for rare variants, common variants, and substitutions. The relationship
between local GC content and the observed conditional variant proportion for seven variant subtypes: (A) AT > GC, (B) AT > CG, (C) AT > TA, (D) CpG GC > AT, (E) GC > AT, (F) GC > TA, and (G) GC > CG. Filled points show the conditional variant proportions in each GC content bin, scaled by the intercept of the logistic
regression , where
  is the intercept calculated in the regression,
  is the count of the given
  variant subtype, and
  is the number of
  ancestral invariant sites that could produce the given subtype in the
  th GC content bin. Symbol size represents the proportion of the given variant subtype falling into a given GC-content bin.
The solid lines show the fitted logistic regression curve, where
th GC content bin. Symbol size represents the proportion of the given variant subtype falling into a given GC-content bin.
The solid lines show the fitted logistic regression curve, where  is the slope fitted in the logistic regression and
  is the GC content in the
  th bin. The gray dashed line represents the baseline of no effect,
  . Legends in each subplot show the regression slope calculated for each variant class and its significance. (***) P-value < 0.0001, (**) P-value < 0.001, (*) P-value < 0.01.


