
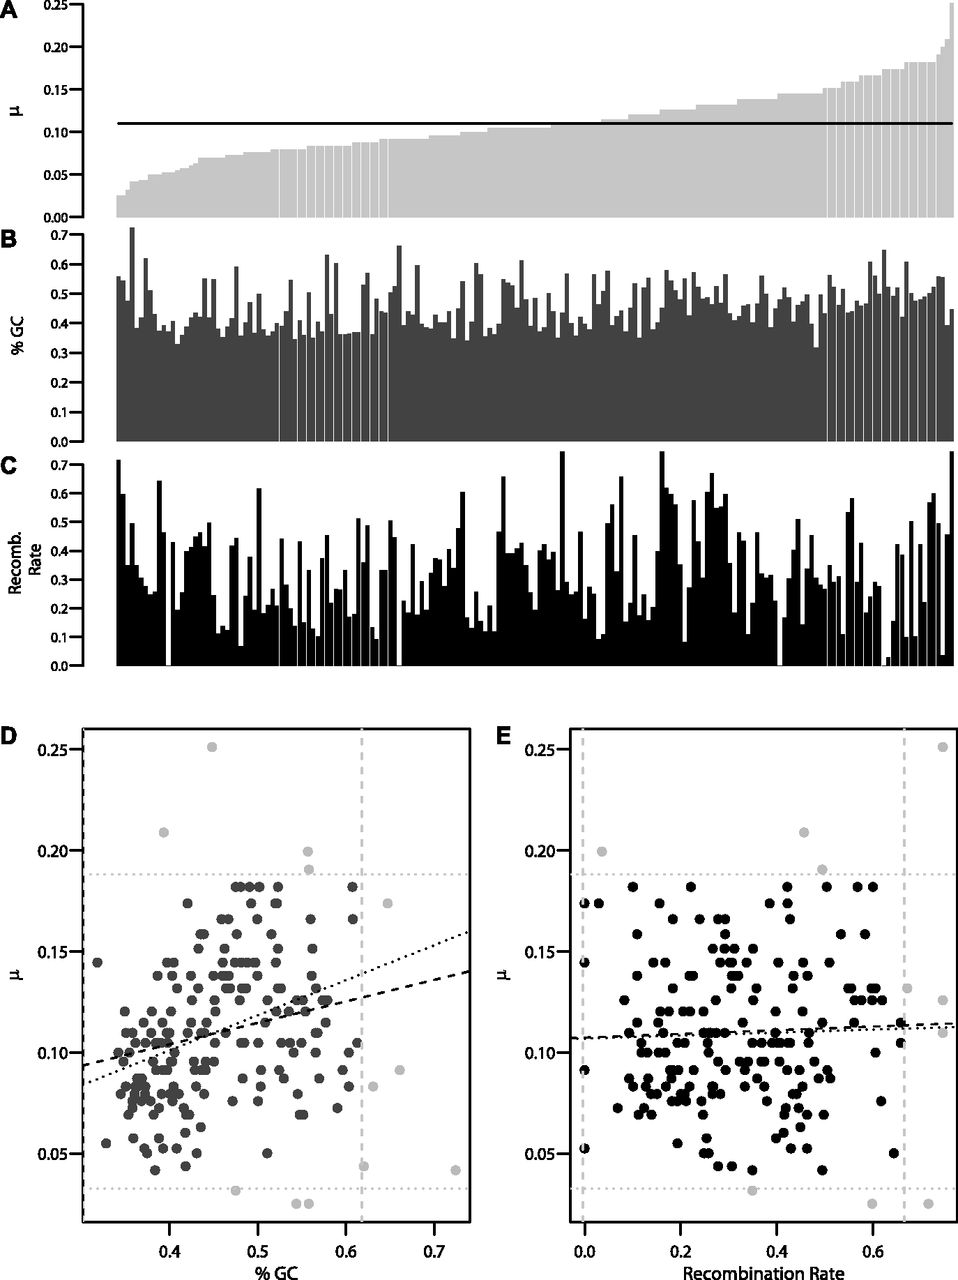
Variability of mutation rates across 193 genes and relationships with genomic context. (A) Per-gene mutations rates (×10−7 per base pair per generation) for 193 genes, estimated previously by coalescent modeling (Nelson et al. 2012), are shown ordered from lowest to highest. The black line indicates the average of 193 genes (1.02 × 10⁻⁸ per base pair per generation). (B) Per-gene average GC content ordered as in A. (C) Per-gene average recombination rate (log10 cM/Mb) ordered as in A. (D) Relationship between GC content and mutation rate. The dashed line represents the linear regression fitting. After removing outliers (gray filled points), the regression was recalculated (dotted line). (E) Relationship between recombination rate (log10 cM/Mb) and mutation rate. The dashed line represents the linear regression fitting. Outliers were removed (gray filled points) and the regression was recalculated (dotted lines).


