
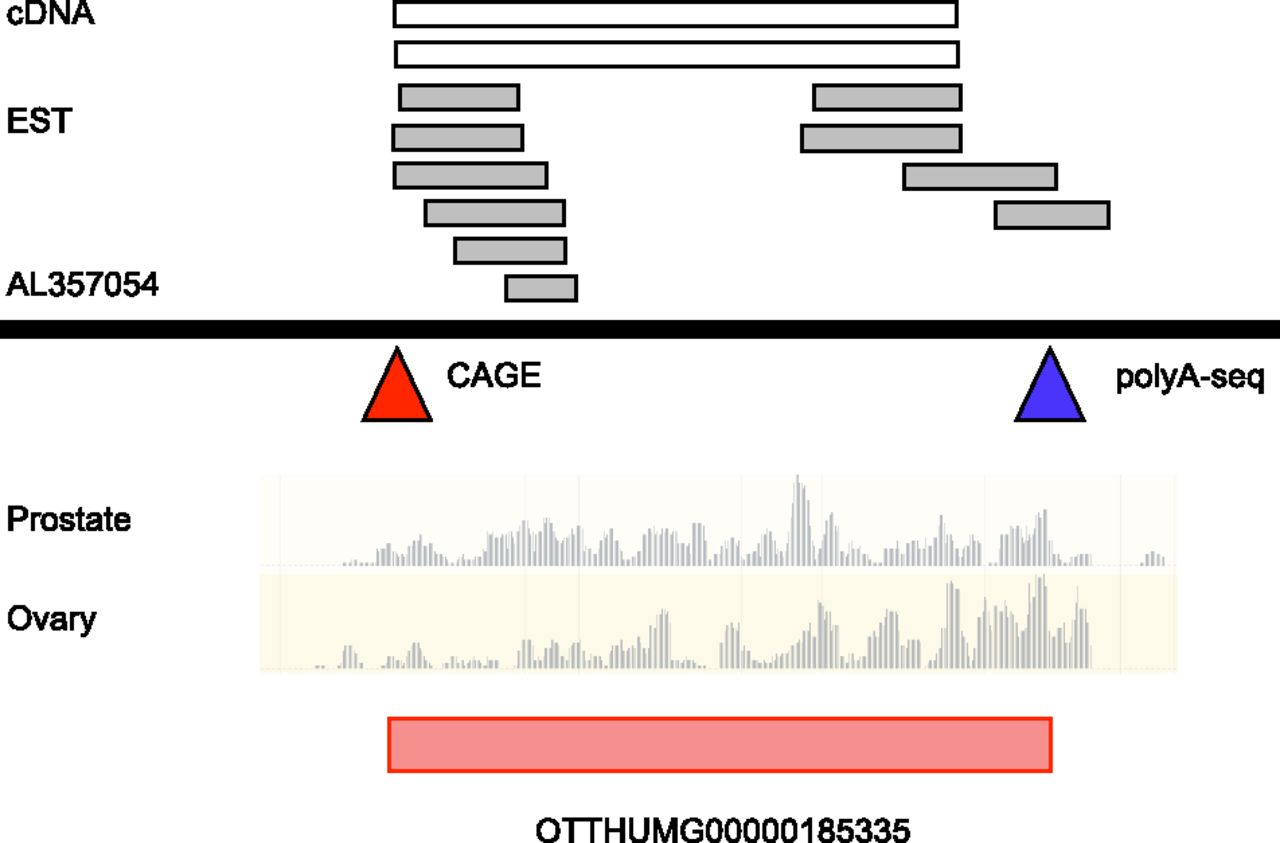
The annotation of a novel lncRNA locus in GENCODE. A schematic diagram of an ∼4-kb region of human chromosome 6 is shown, within BAC AL357054. The alignment of cDNA (accession numbers AX747750, AK092822) and EST (DA816101, DA923061, DA427401, BG541155, AI831721, AW135930, CB052137, DB332016, CB052136, AA004346) data indicate the location of a transcribed locus. Further support comes from the mapping of CAGE and polyA-seq clusters, indicated by red and blue triangles, respectively. CAGE data are taken from the ENCODE project (Djebali et al. 2012a) and polyA-seq data are taken from Derti et al. (2012). For CAGE, co-locating clusters are found in the majority of cells investigated by ENCODE, including primary non-immortalized lines (not shown). Co-locating polyA-seq clusters are derived from brain, testes, and muscle tissues (not shown). Underneath is Illumina Human BodyMap 2.0 RNA-seq data from two representative tissues out of 16 available—prostate and ovary—in the form of read coverage graphs. These data were mapped to the genome by Ensembl, using the BWA methodology (Li and Durbin 2009; Flicek et al. 2013). The correspondence between each of these data sets allowed for a new 2814-bp lncRNA model to be built (red rectangle; subcategorized as a lincRNA biotype; see Fig. 1B), accession number OTTHUMG00000185335.


