
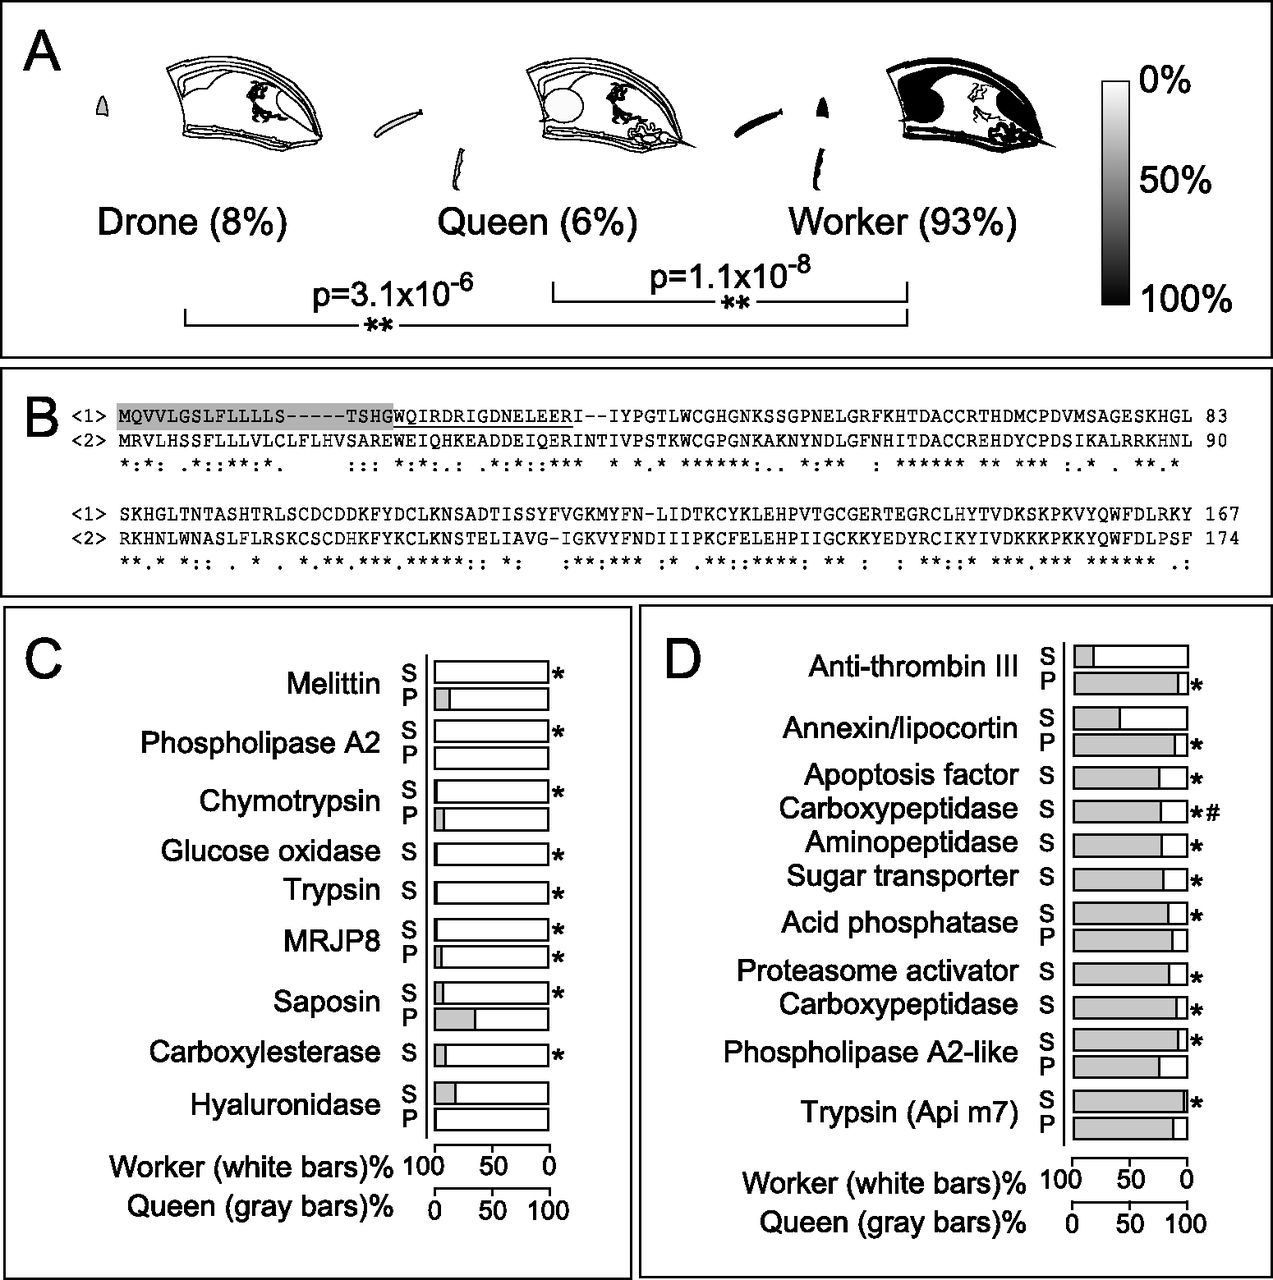
Proteome of the poison and sting apparatus: select proteins. (A) Relative abundance of phospholipase A2 (gi:58585172) in the organs of each caste is shown on a grayscale, and the whole-body average is shown in parentheses. Worker expression is significantly different from the others; (**) P < 0.01). (B) Multiple sequence alignment of <1> phospholipase A2 and <2> phospholipase A2-like (gi:110758297). The signal peptide (gray) and propeptide (underlined) are as given in Kuchler et al. (1989). Select proteins that tend to be more highly expressed in (C) workers (white bars) and (D) queens (gray bars) in the poison sac (P) and stinger (S) are shown; (*) P < 0.05, (#) the protease also found in the digestive tract.


