
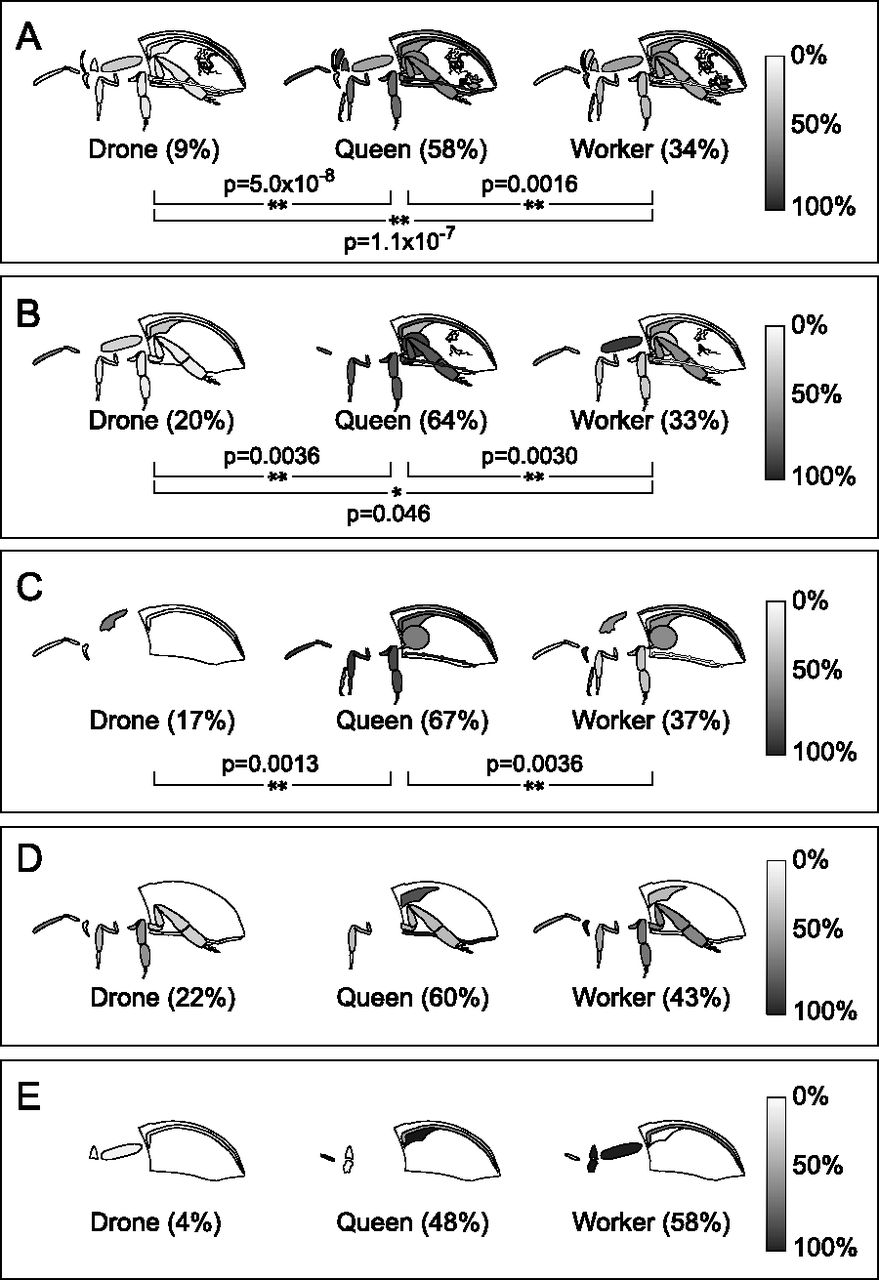
Figure 5.
Caste and organ distribution of immunity proteins. (A) PPO, (B) PGRP-S3, and (C) GNBP 1-2 expression is significantly higher in queens compared with the other castes. Overall expression levels of the antimicrobial peptides hymenoptaecin (D) and defensin (E) are not different (P > 0.1), except that drones express far less defensin than queens or workers. Relative levels across each organ shown on a grayscale. Whole-body averages are shown in parentheses; (*) P < 0.05, (**) P < 0.01.


