
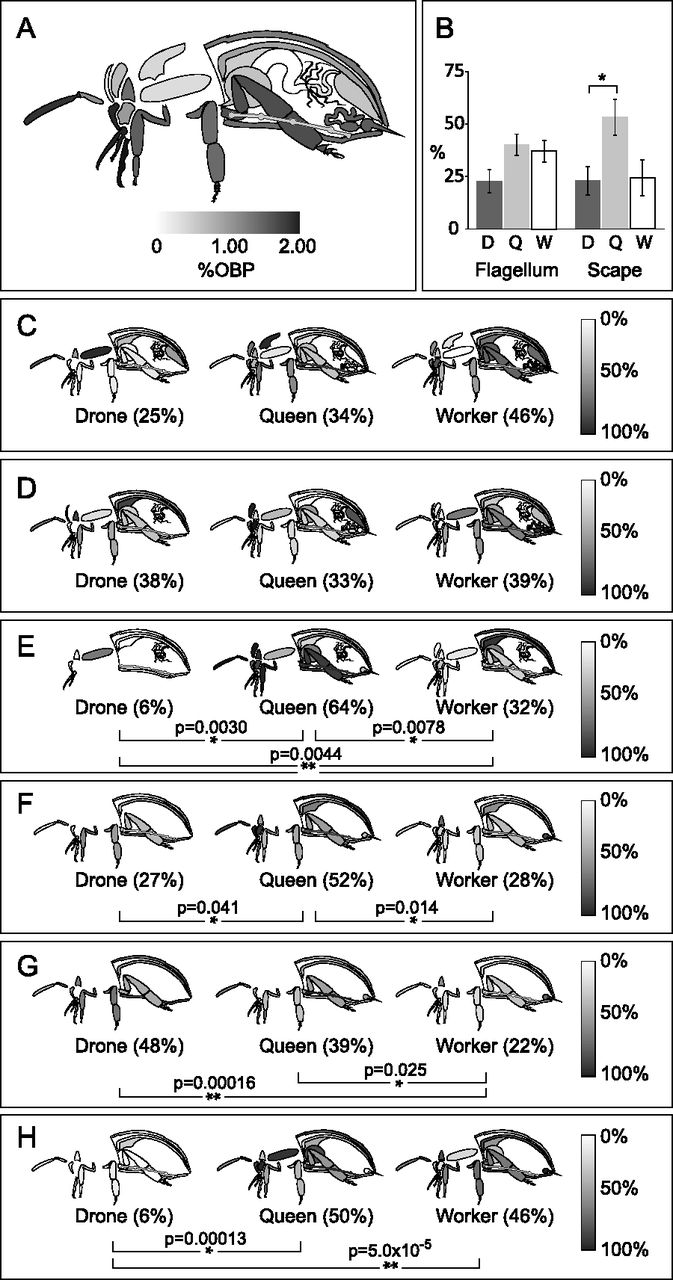
Figure 4.
Caste and organ distribution of OBPs. (A) OBPs as a fraction of all quantified proteins across castes. (B) The percent expression of all quantified OBPs in each caste, averaged across the flagellum (the long distal portion of the antenna, n = 16) and the scape (the short proximal portion, n = 11) (±SEM). The relative abundance of OBP14 (C), CSP3 (D), OBP3 (E), OBP17 (F), OBP18 (G), and OBP21 (H) in the organs of each caste is shown on a grayscale. Whole-body averages are shown in parentheses; (*) P < 0.05, (**) P < 0.01.


