
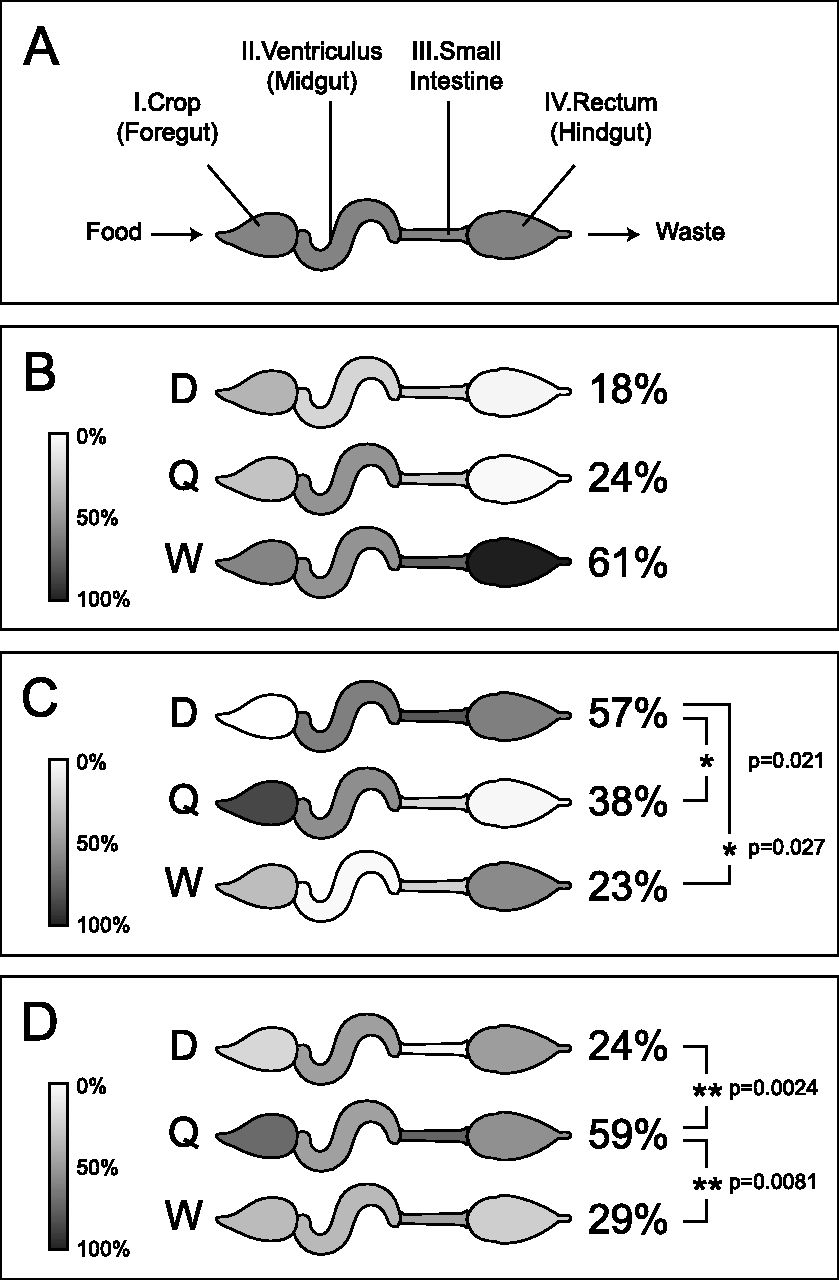
Figure 2.
Caste-dependent differences in major digestive system enzymes. (A) The abdominal sections of the digestive tract. Relative expression values of major enzymes for digestion of mono- and polysaccharides (B), proteins (C), and lipid transport (D) are shown on a grayscale. Averages among the four organs are shown in parentheses; (*) P < 0.05, (**) P < 0.01.


