
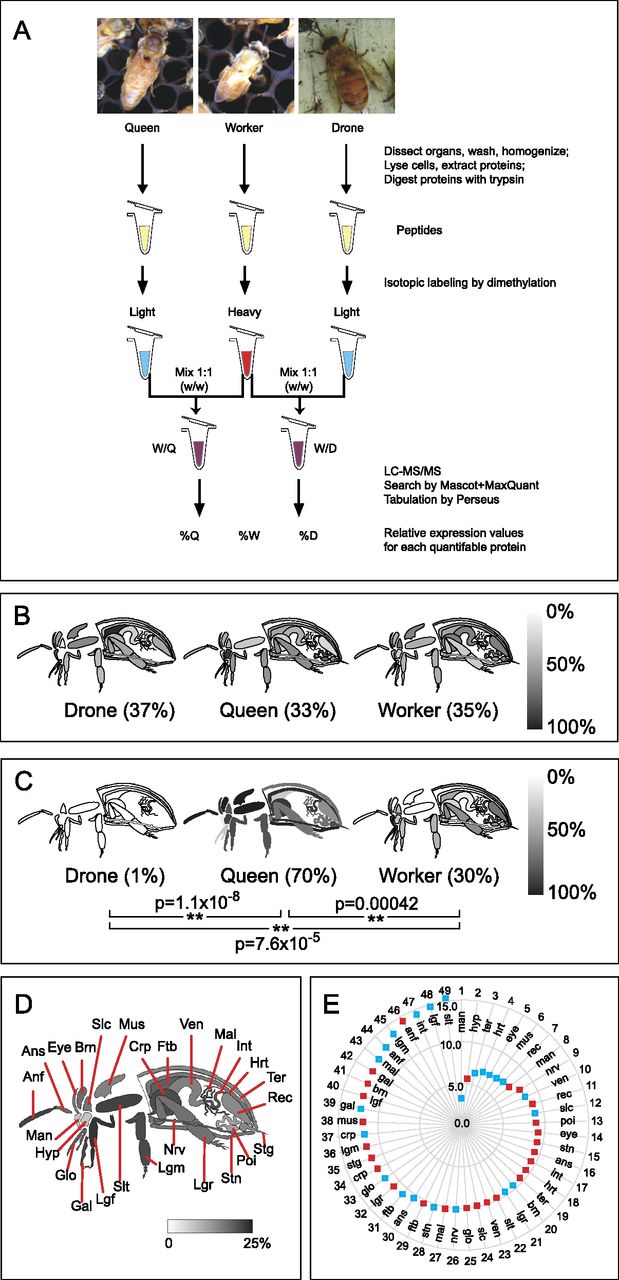
An overview of the Honey Bee Protein Atlas. (A) Sample handling flowchart. Worker proteins from each organ served as a reference against which queen and drone organs were compared. The relative abundance of actin (B) and vitellogenin (C) in the organs of each caste are shown on a grayscale. The absence of an organ indicates that either the organ does not exist (e.g., stinger in drones) or the protein was not detected there. Whole-body averages are shown in parentheses; (**) P < 0.01. (D) A diagrammatic representation of each tissue, and the percentage of quantified proteins in queens and/or drones whose expression level is significantly different from the worker at P < 0.05. Individual percentage differences in queen–worker (red squares) and drone–worker (blue squares) comparisons for the tissues are shown as a radar graph (0% at the origin up to 15%) in E, arranged from the least different (wheel position 1) to most different (wheel position 49) tissue. (anf) flagellum (antenna); (ans) scape (antenna); (brn) brain; (crp) crop (forgut); (ftb) fat body; (gal) galea (mouthpart); (glo) glossa (mouthpart); (hrt) heart; (hyp) hypopharngeal gland (queen and worker only); (int) intestine; (lgf) front leg; (lgm) middle leg; (lgr) rear leg; (mal) Malpighian tubules; (man) mandibular gland; (mus) thorax muscle; (nrv) nerve; (poi) poison sac (queen and worker only); (rec) rectum; (slc) post-cerebral salivary gland; (slt) thoracic salivary gland; (stg) sting (queen and worker only); (stn) sternite; (ter) tergite; (ven) ventriculus (midgut).


