
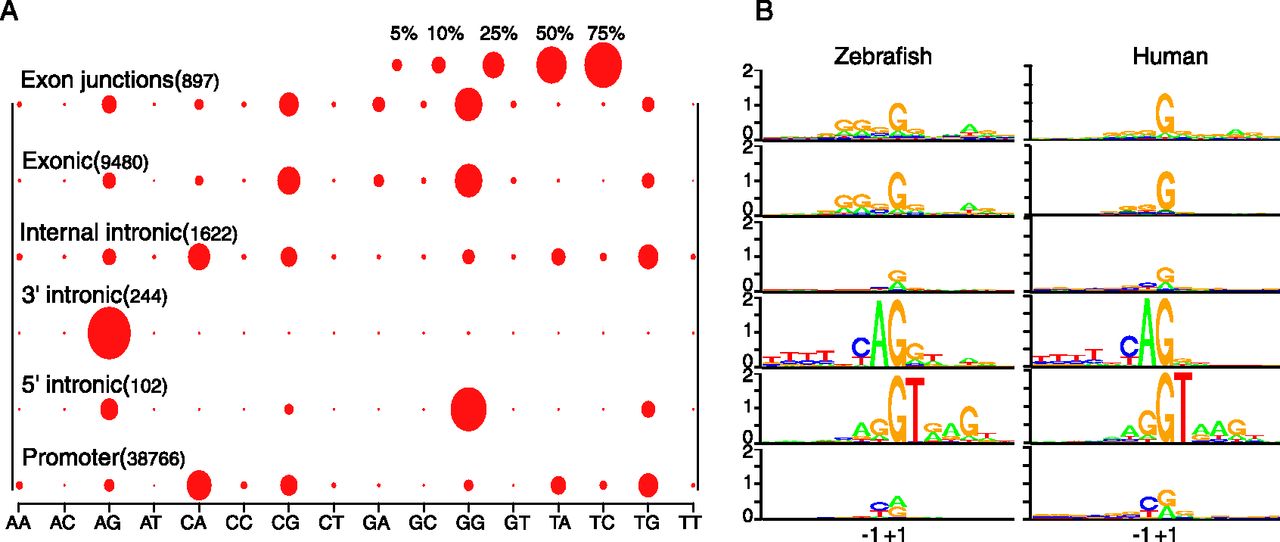
Figure 6.
Intragenic CAGE tags do not carry core promoter features. (A) Dinucleotide frequency analysis of dominant CTSSs (−1,+1 bp) of gene 5′-end promoter and of intragenic RNA products. Relative abundance of dinucleotides is shown in bubbles of varying size. Number of TCs analyzed from 12 stages are indicated in brackets (repeat incidences in multiple stages are not included). (B) Sequence logos and their information content of dominant CTSSs (−1,+1 bp) at gene 5′-end and intragenic sites in zebrafish and human.


