
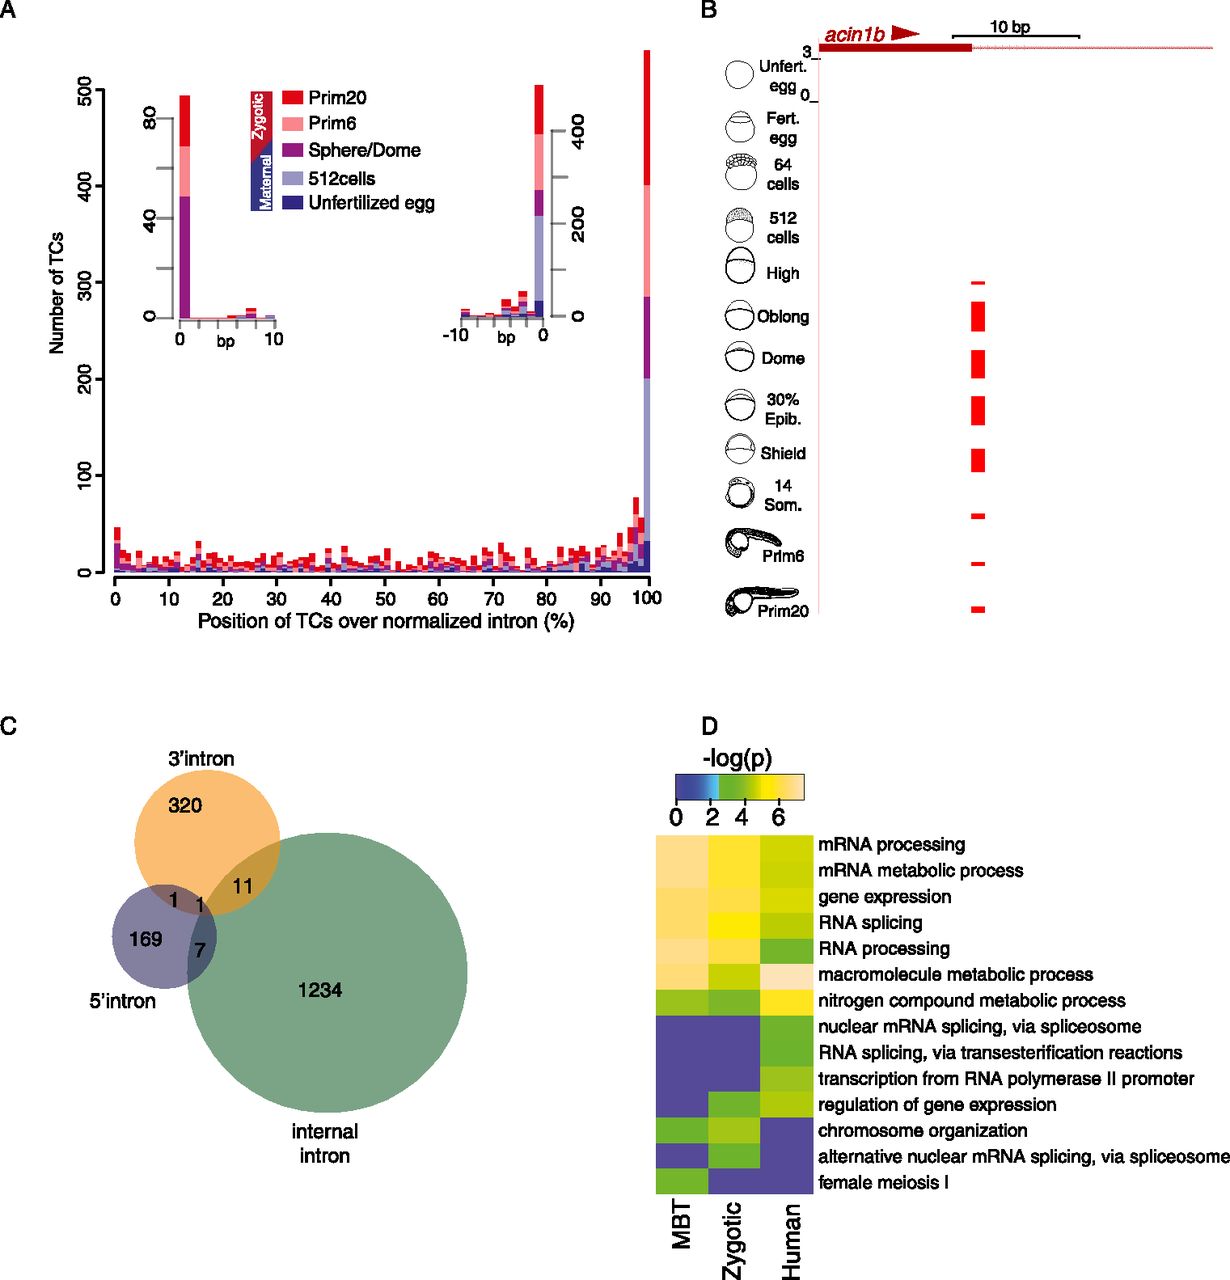
Distribution and developmental regulation of intronic CAGE tags. (A) Distribution of all intronic TCs aggregated and aligned in windows of 1% length of a normalized intron. TCs in specific stages are shown in colors as indicated. Insets show aggregates of CAGE tags aligned at single bases, up to 10 bases from either side of intron ends. (B) A genome browser view of splice donor site of the acin1b gene and associated intronic 5′-end CAGE tags. (C) Venn diagram of intersection and number of genes with various types of intronic TCs. (D) Enriched GO terms of genes with intron 5′-end CTSSs in zebrafish and human. The heat map represents the –log (P-values) of significantly enriched GO terms. (MBT) Mid-blastula transition.


