
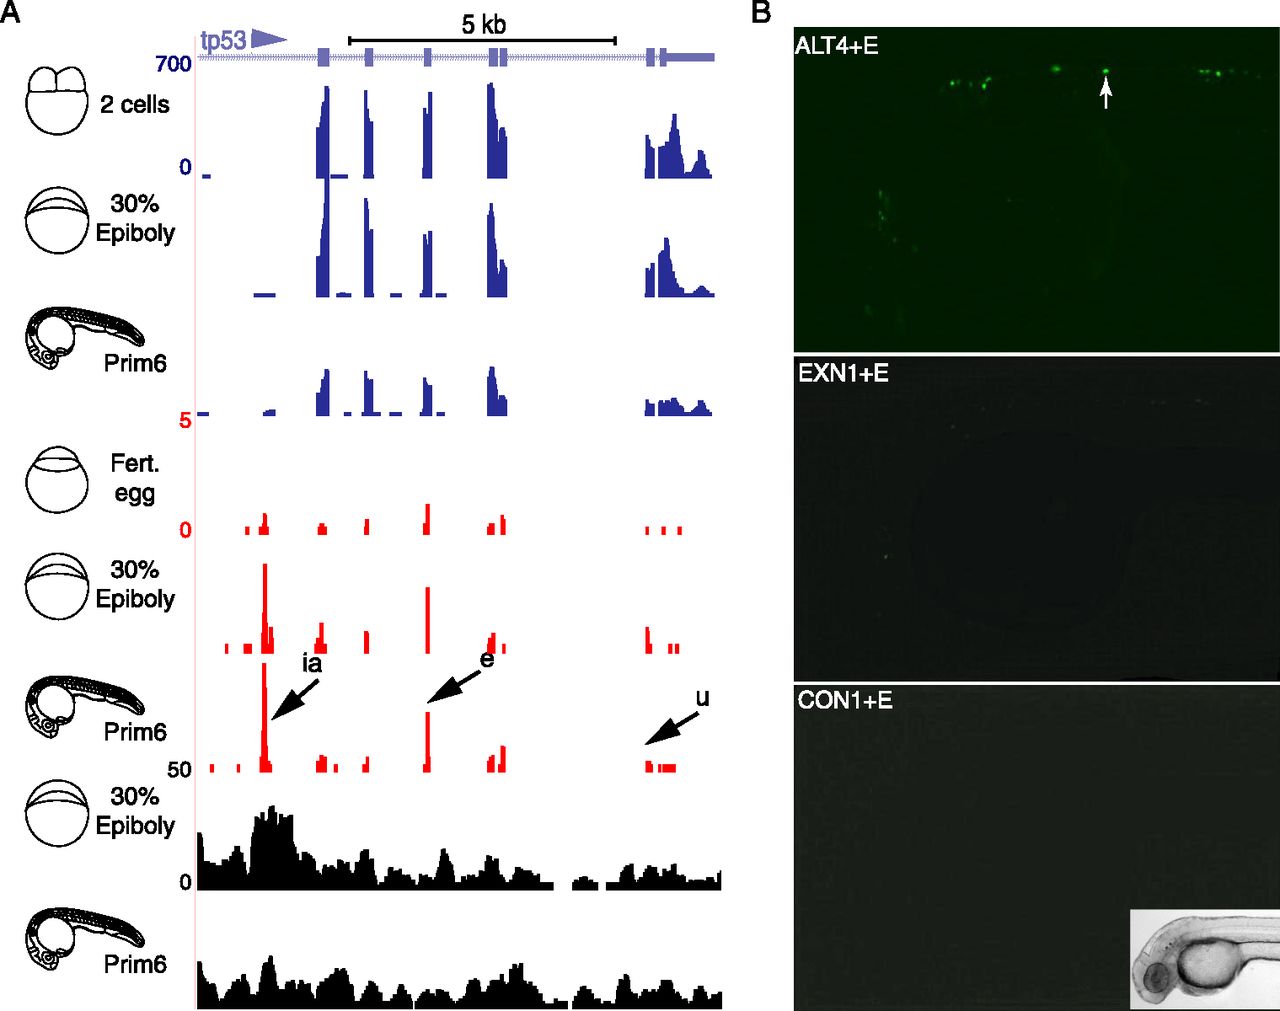
Exonic CAGE tags during development. (A) A genome browser view of the intragenic region of the tp53 gene. Arrow with “ia” indicates the intronic alternative promoter of the delta117p53 variant (Chen and Peng 2009; Chen et al. 2009). Arrows labeled “e” and “u” indicate RNA start sites of exonic and 3′-UTR regions, respectively. (B) Lack of fluorescent Venus reporter activity in maximum projection overlays of 36 hpf embryos injected with an exonic CAGE marked candidate promoter region (EXN1) as compared with an active core promoter (ALT4) and a negative control (CON1) linked to a neural specific enhancer (E) (details in Supplemental Table 8). Insert of a bright-field image of an embryo is shown as reference for view of fluorescence image.


