
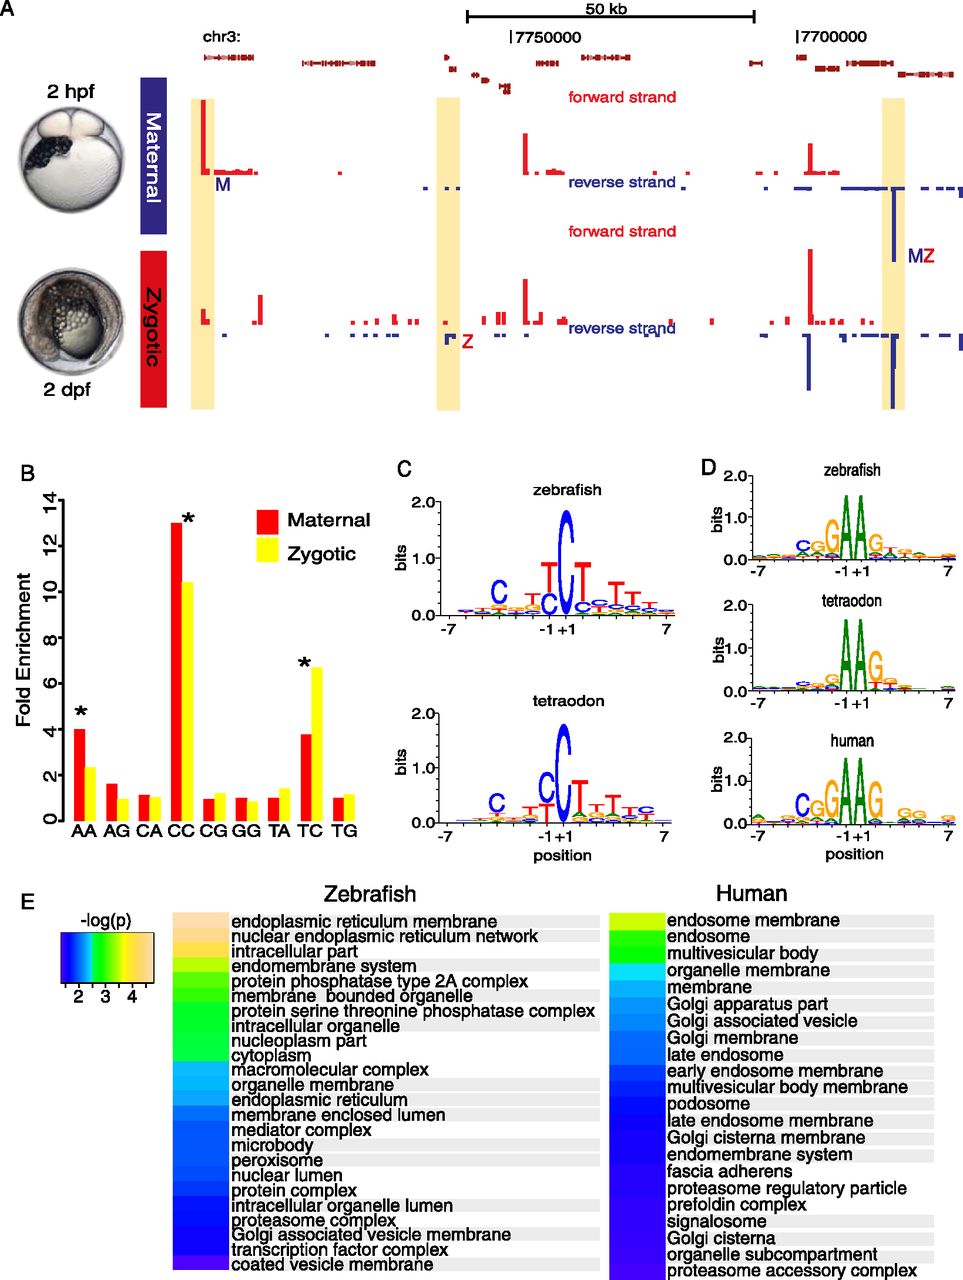
Sequence characteristics of developmentally regulated core promoters are evolutionarily conserved. (A) A genome browser view with annotated Tetraodon genes (top of the panel) along with CAGE-seq tracks from two developmental (maternal and zygotic) stages. In yellow boxes, core promoter regions of annotated genes expressed specifically at maternal (M), zygotic (Z), or maternal and zygotic stages (MZ). CTSSs in red and blue indicate sense and antisense direction, respectively. (B) Correlation of dinucleotides of CTSSs (−1,+1) between zebrafish and Tetraodon orthologs represented as fold enrichments vs. expected by chance. Asterisks denote significant correlations (P ≤ 0.05). Only dinucleotides, which occur at TSSs, are shown. (C,D) Sequence logos and their information content of initiator motifs for selected dinucleotides: (C) CC/TC and (D) AA dinucleotides. Human genes with “AA” initiation motifs were plotted from ENCODE cell lines (see Methods). (E) Enriched GO terms of genes with AA initiator. Identical terms are highlighted in gray. Heat map represents the –log (P-values) of enriched GO terms.


