
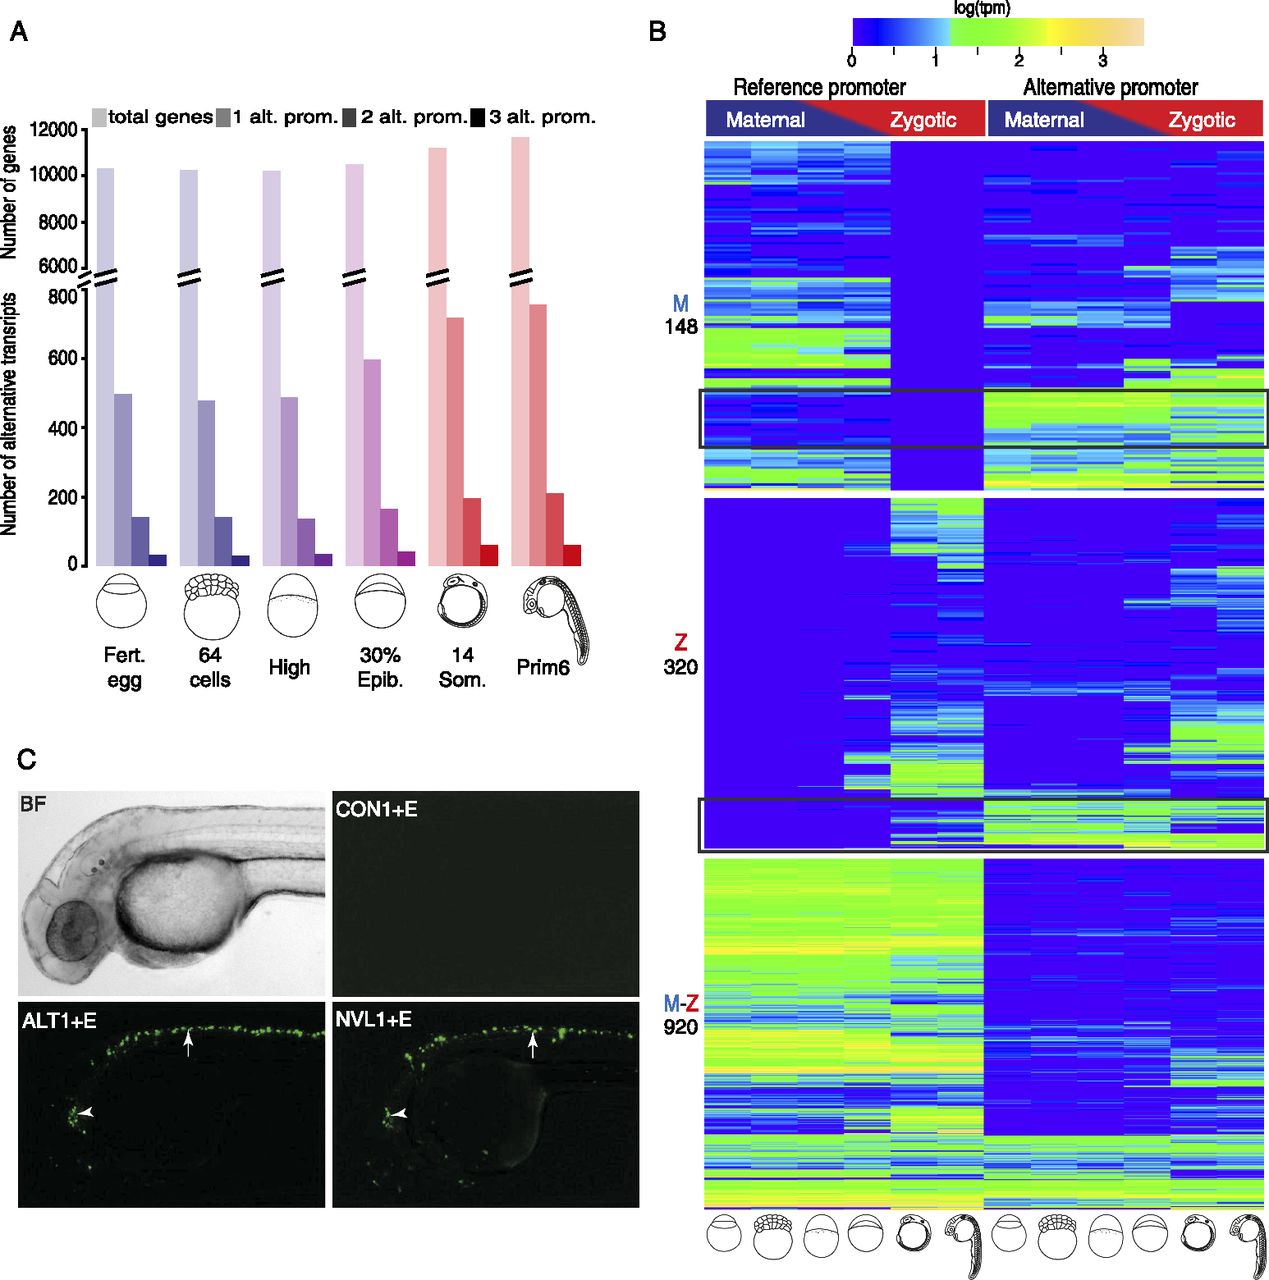
Identification and developmental dynamics of alternative initiation sites. (A) Frequency and developmental dynamics of alternative promoters. Colors reflect maternal to zygotic transition as in Figure 1. Genes with up to three alternative promoters are plotted (see Supplemental Table 7 for details). Shades indicate alternative promoter numbers, color transition indicates maternal to zygotic transition of transcriptome. (B) Clustering of three sets of genes based on their reference promoter activity. Annotated reference promoters (as assigned by Ensembl 71) are on the left and alternative promoters on the right. Genes are clustered in three groups according to the reference promoter being active during maternal (M), zygotic (Z), or maternal and zygotic (M-Z) stages. Total number of genes in each group is indicated in the left. Black rectangles indicate genes where the previously unannotated alternative promoter's activity is preferential over that of the annotated reference promoter. (C) Fluorescent Venus reporter activity driven by alternative (ALT1) and novel (NVL1) core promoters attached to a neural specific enhancer (E) in transgenic embryos. Control (CON) indicates a random DNA fragment replacing a promoter. Maximum projections of embryos overlaid from a single injection experiment are shown (see details in Supplemental Table 8). Bright-field (BF) image of a single zebrafish embryo is shown for reference. (Arrowhead) Cerebellum; (arrow) spinal cord activity.


