
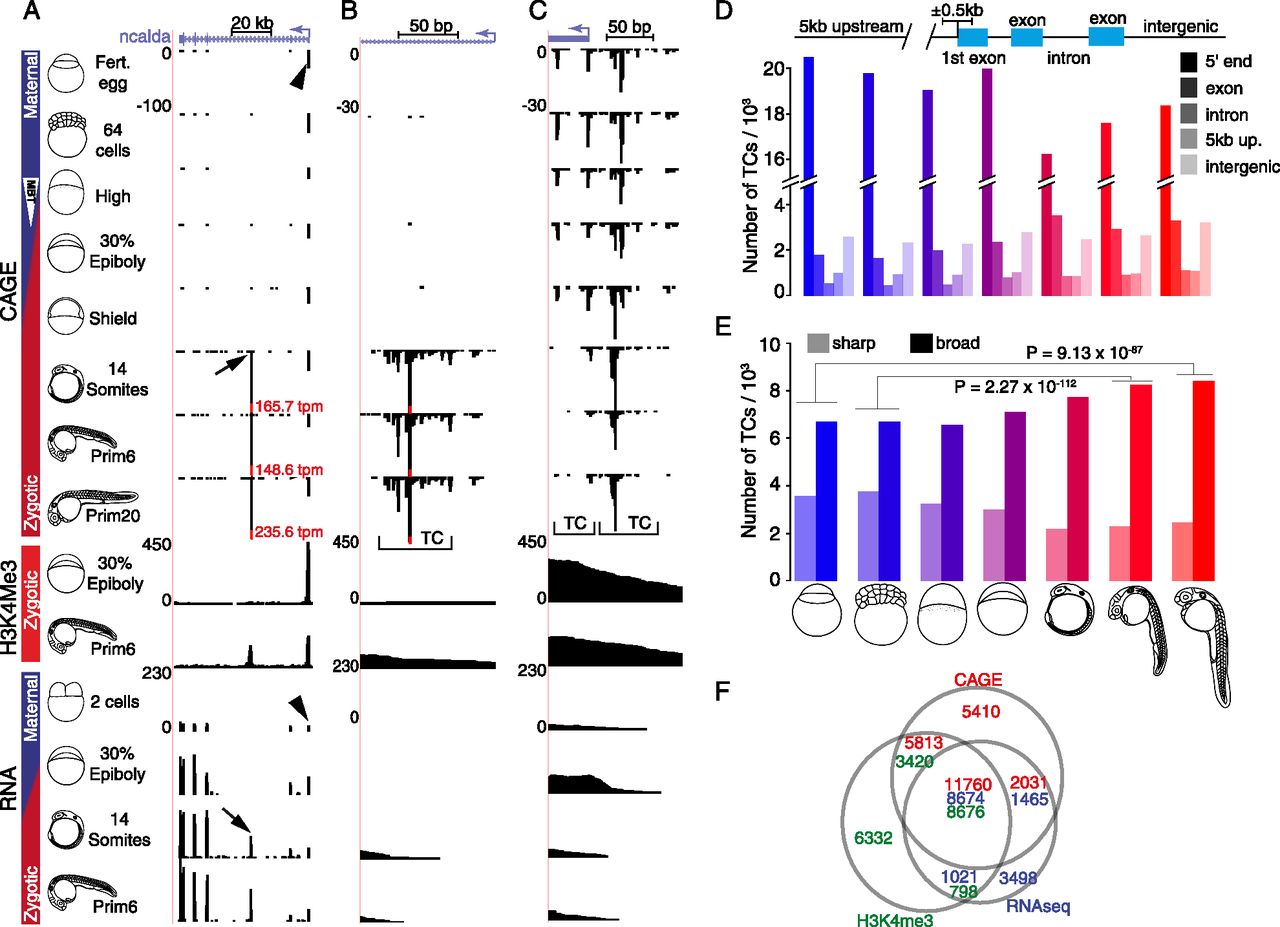
Mapping of transcription initiation in zebrafish embryo development. (A–C) Genome browser view of ncalda gene with CAGE-seq, ChIP-seq, and RNA-seq tracks from selected developmental stages. Schematic representation of developmental stages is on the left. Vertical bar with blue (maternal) and red (zygotic) bars indicates transcriptional activity of the genome. White arrowhead indicates the onset of zygotic transcription at the mid-blastula transition (MBT). Vertical scales on the left of tracks are tpm values and fixed within experiments. Height of the CTSS bars is proportional to the number of CAGE tags aligned to that position. Transcript clusters (TC) of varying width are labeled with brackets. (A) Full-length transcripts of ncalda indicating two promoter regions (arrow and arrowhead) were detected by CAGE and verified by H3K4me3 peaks and RNA-seq data. (Fert) Fertilized. (B) High-resolution mapping of zygotically active novel alternative TSS (arrow in A) of ncalda gene. (C) High-resolution mapping of continuously active Ensembl annotated TSS (arrowhead in A) of ncalda gene. (D, top) Schematic of gene structures for analysis of distribution of TCs. (Bottom) Number of TCs overlapping with the annotated segments of the genome is shown at the developmental stages indicated by schematics. Colors from blue to red indicate transition from maternal to zygotic transcriptomes. (E) Distribution of sharp and broad TCs at selected developmental stages. Shades of color indicate gene segment, blue to red transition indicates maternal to zygotic transition of transcriptome. P-values of one-tailed Fisher's exact test for selected comparisons are denoted above the bars. (F) Intersection of Ensembl gene 5′-ends detected by CAGE (>1 tpm, shown in red), RNA-seq (>1 rpkm, shown in blue), and H3K4me3 peaks (in green) at prim-6 stage.


