
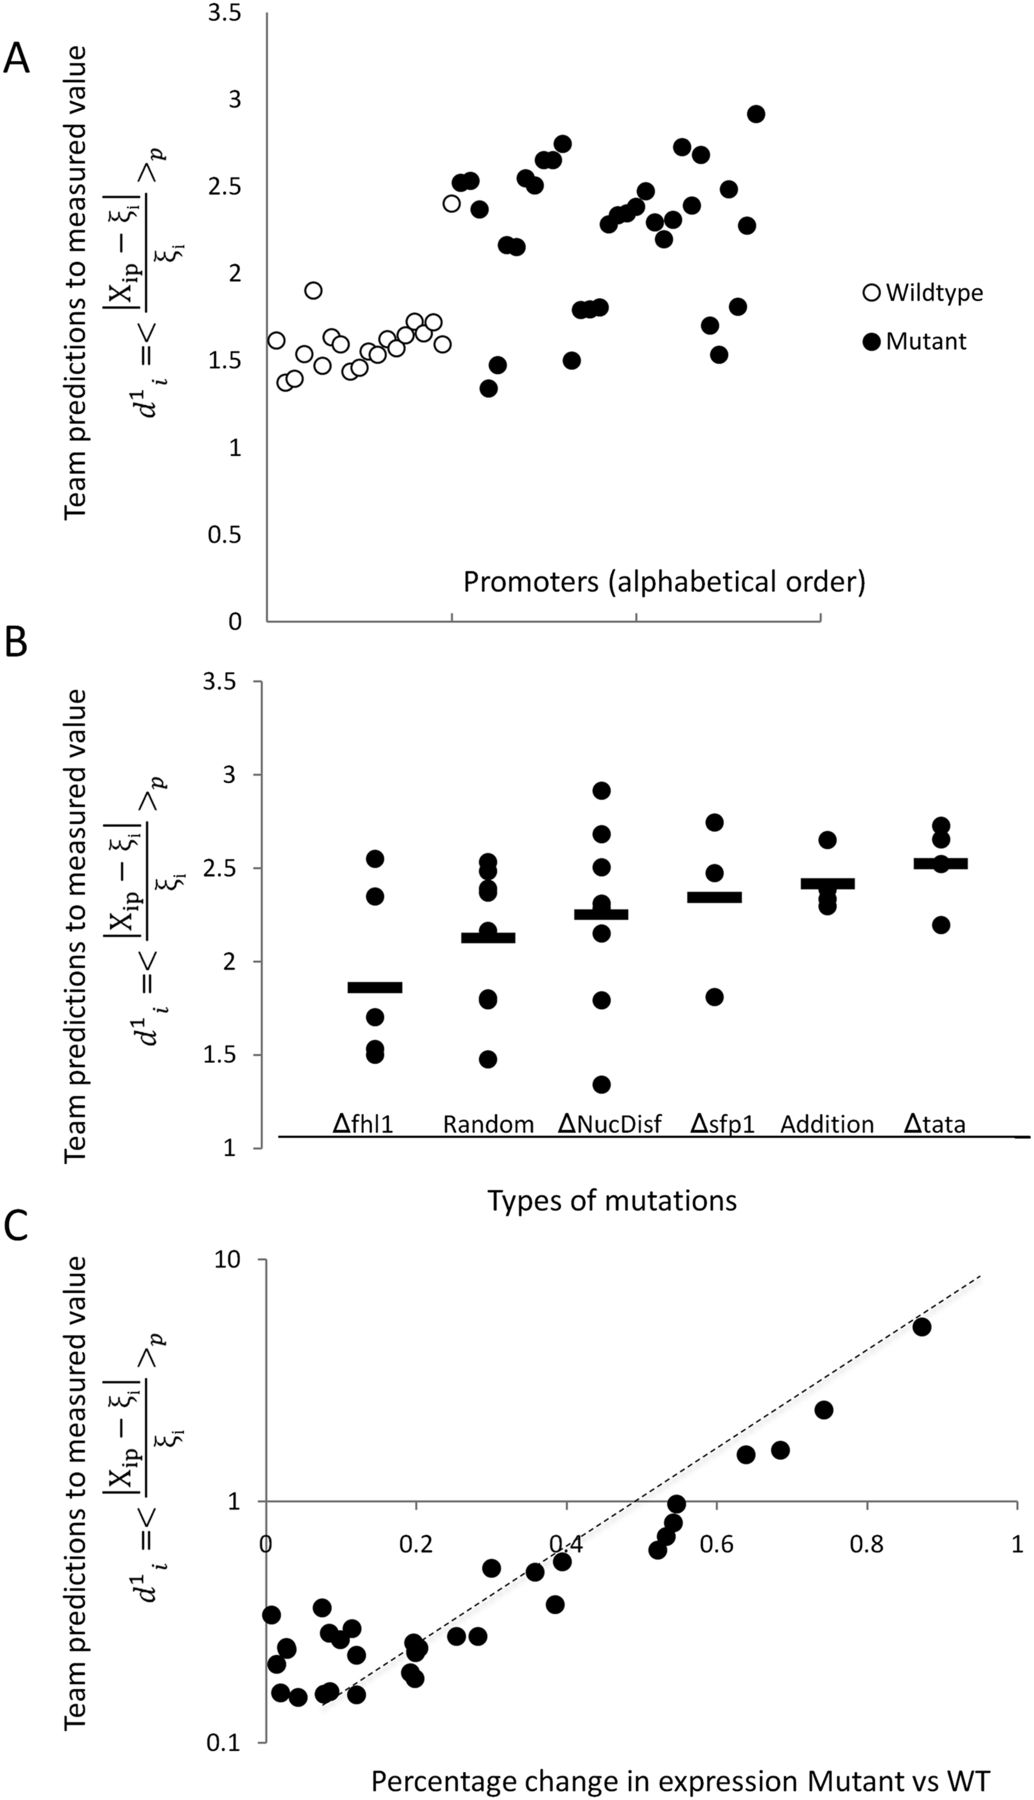
Analysis of prediction results for mutated promoters. (A) Promoters were divided into two groups depending on whether they were wild type (empty dots) or contained mutations (full
dots) and plotted according to  , where
  is the predicted value of promoter i and participant p = 1,2…21, and
  is the measured value for promoter i = 1,2…53. (B) Mutant promoter expression values were grouped according to the nature of the mutation and ordered by mean
  value for each group. The six groups consist of mutations of TATA boxes (Δtata), of binding sites for Fhl1 (Δfhl1) and Sfp1
(Δsfp1), mutations to nucleosome disfavoring sequences (ΔNucDisf), random mutations (Random), and finally, sequences mutated
intentionally with additional random mutations (Addition). The
value for each group. The six groups consist of mutations of TATA boxes (Δtata), of binding sites for Fhl1 (Δfhl1) and Sfp1
(Δsfp1), mutations to nucleosome disfavoring sequences (ΔNucDisf), random mutations (Random), and finally, sequences mutated
intentionally with additional random mutations (Addition). The  value for each promoter is indicated by full dots; the mean value of
  for each of the six grouped mutations is indicated by a thick bar. (C) For each mutated promoter i,
  is plotted as a function of the percentage of expression value change induced in the wild-type promoter by the mutation.
The vertical scale is logarithmic.
is plotted as a function of the percentage of expression value change induced in the wild-type promoter by the mutation.
The vertical scale is logarithmic.


