
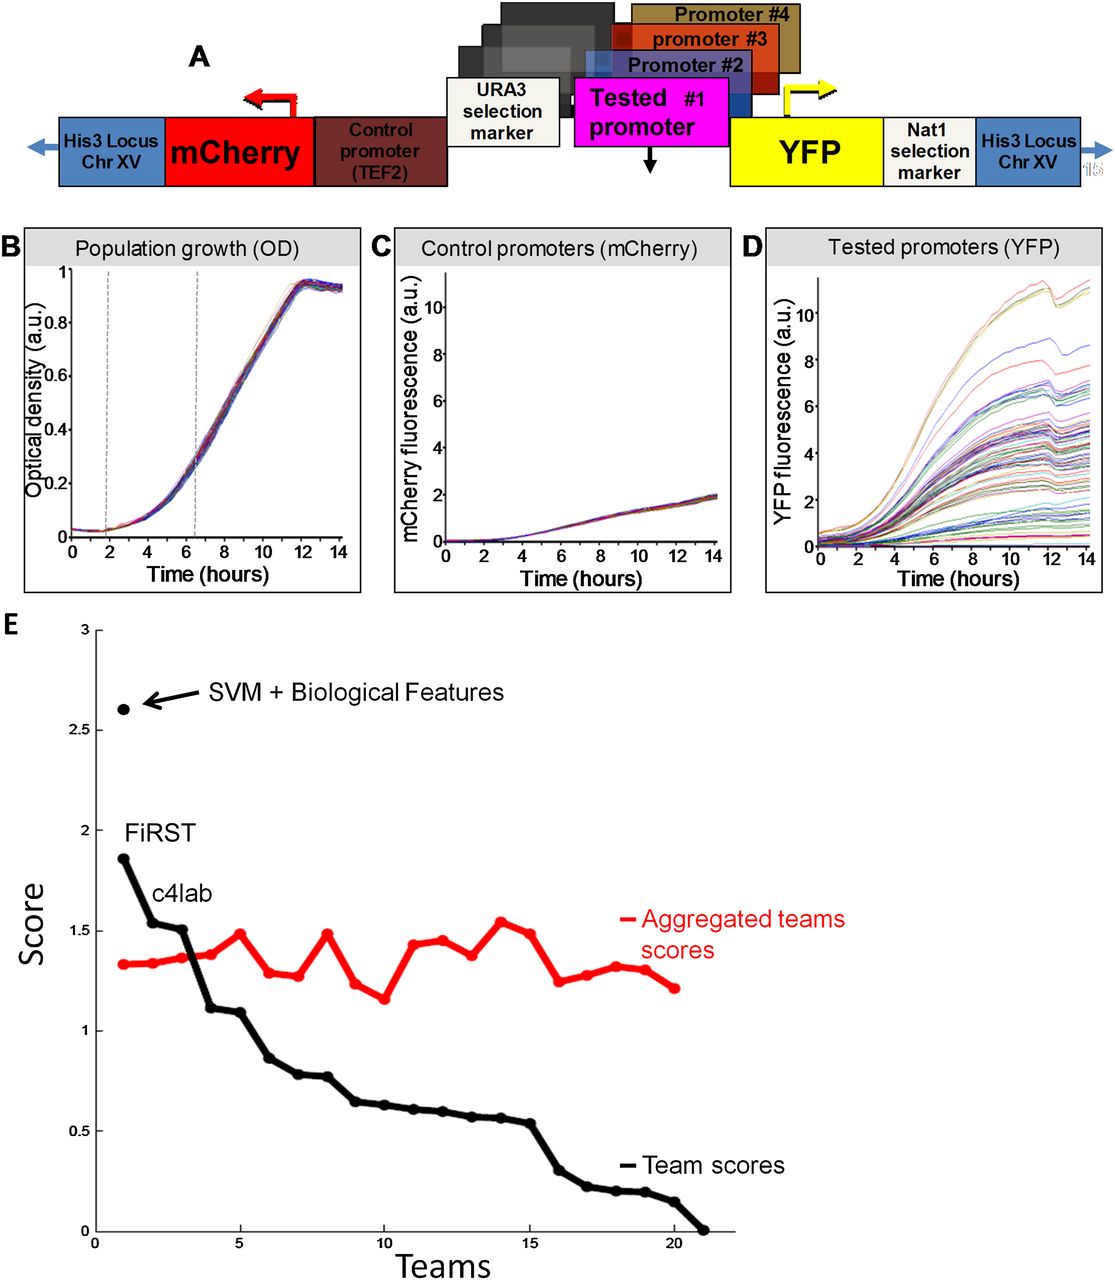
Overview of the experimental system and results. (A) Illustration of the master strain into which we integrated all the tested promoters. At a fixed chromosomal location, the master strain contains a gene that encodes a red fluorescent protein (mCherry), followed by the promoter for TEF2, and a gene that encodes for a yellow fluorescent protein (YFP). Every tested promoter is integrated into this strain, together with a selection marker, between the TEF2 promoter and the YFP gene. (B) Strains with different promoters have highly similar growth rates. Shown is the growth of 71 different promoter strains, measured as optical density (OD). Measurements were obtained from a single 96-well plate, with glucose-rich media and a small number of cells from each strain inserted into each well at time zero. The exponential growth phase is indicated (vertical dashed gray lines). (C) Same as B, but where the measurements correspond to mCherry intensity. Note the small variability in the intensity of mCherry, which is driven by the same control promoter across the different strains. (D) Same as C, but where the measurements correspond to YFP intensity. Note the large variability in the intensity of YFP, which is driven by a different promoter in each strain. (Adapted with permission from Zeevi et al. [2011].) (E) Black line shows the scores from different participating teams plotted in descending order, and red line shows scores of aggregated teams starting with the score obtained from averaging the prediction results of the two best-performing teams, followed by the three best-performing teams, and so on until all 21 teams are included. The stand-alone dot represents the post-hoc model combining SVM and biological features.


