
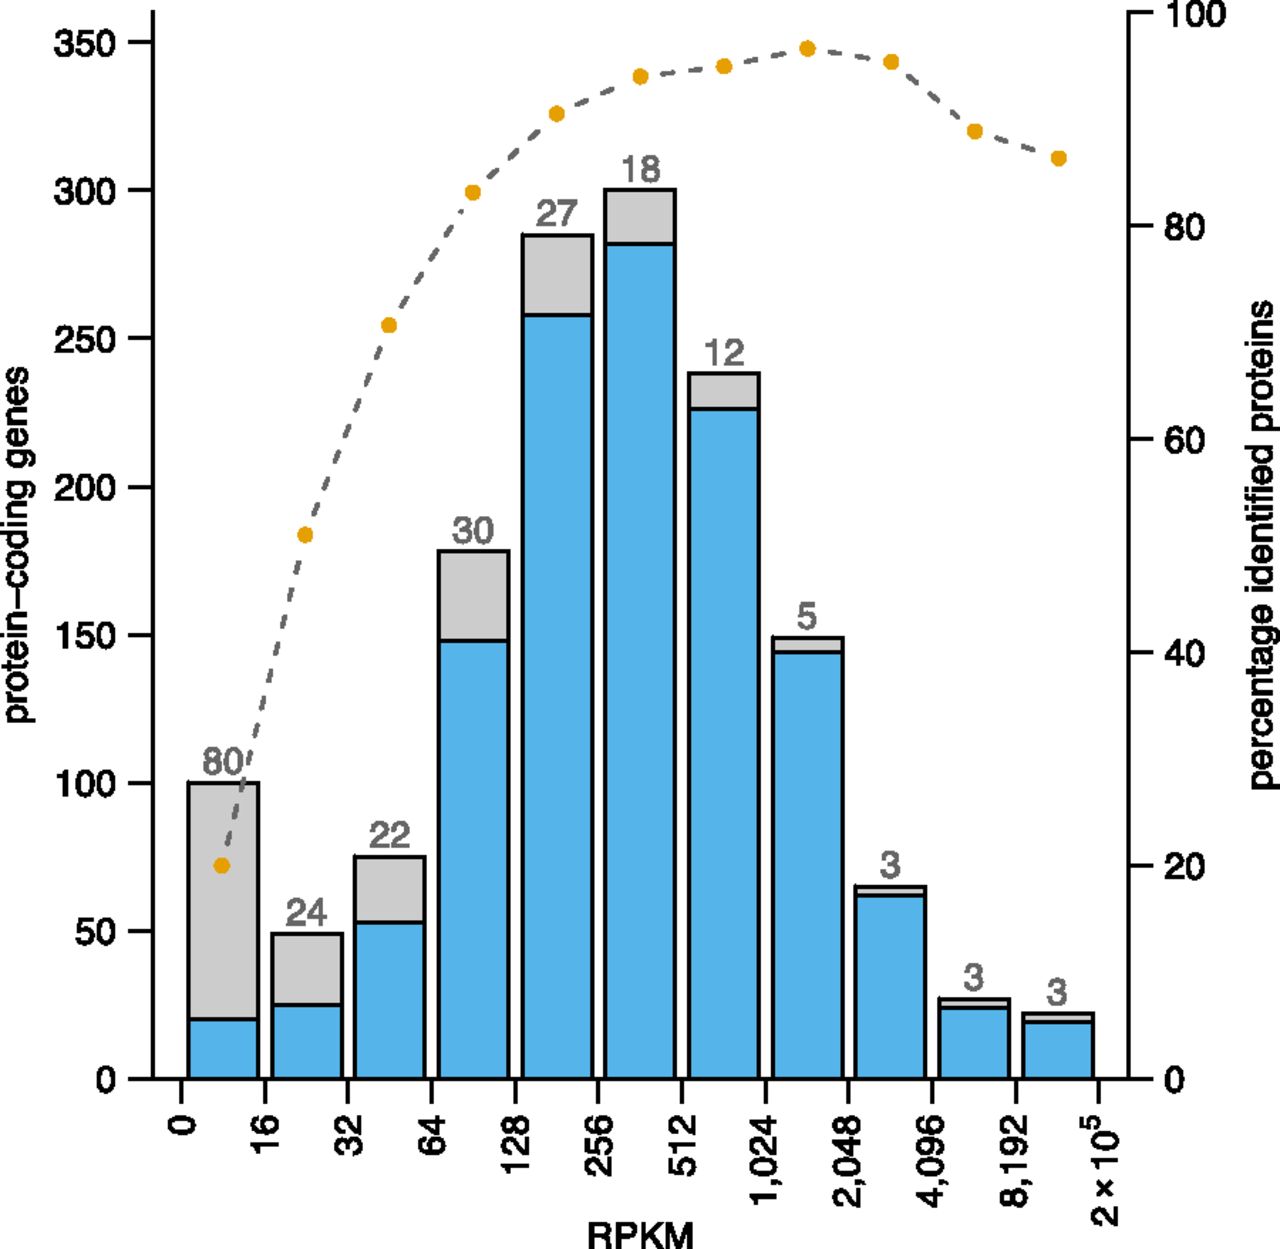
Figure 4.
Correlation of gene expression strength and successful protein identification rate. Protein-coding genes are binned according to strength of gene expression (the maximum RPKM value of both states). The success rate in identifying the encoded proteins in each bin is represented by the blue area of the bars; orange dots above the barplot indicate the respective percentage. The numbers above the bars show how many proteins were not identified within a given bin (for a total of 217 distinct proteins).


