
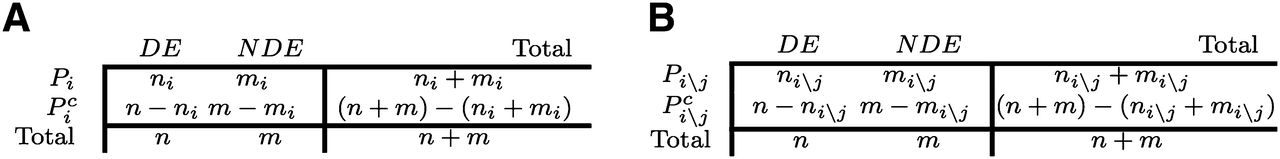
A comparison of the classical overrepresentation analysis (A) with the crosstalk matrix analysis proposed here (B). (A) The standard overrepresentation approach contingency table: ni + mi and n + m represent, respectively, the number of genes belonging to pathway Pi and the total number of genes. ni and n represent, respectively, the number of differentially expressed genes belonging to pathway Pi and the total number of DE genes. (B) Contingency table for the overrepresentation approach, taking into account the overlap between pairs of pathways; Pi\j represents the set of elements in Pi excluding the intersection with Pj; with the notations ni\j + mi\j we represent the total number of genes that are in pathway Pi but not in pathway Pj, and with ni\j the number of DE genes that are in pathway Pi but not in pathway Pj.


