
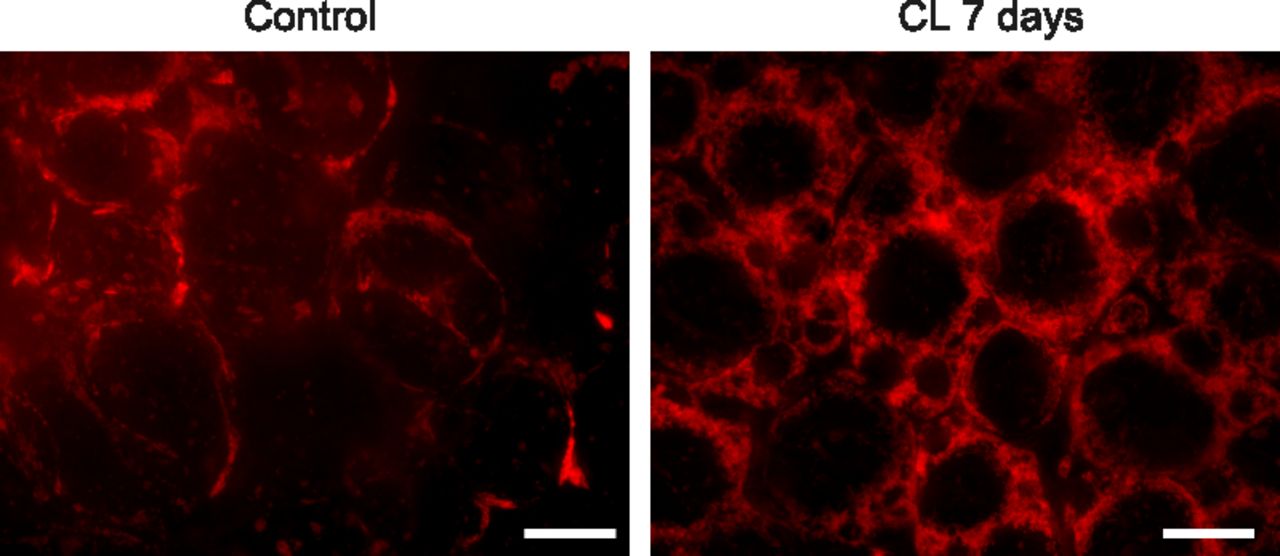
Figure 6.
Epididymal white adipose tissue of a control mouse (left) and a mouse treated with CL for 7 d (right). Treatment with CL for 7 d triggered massive mitochondrial biogenesis, demonstrating in vivo that indeed, the mitochondrial pathway is central in this experiment. White bar, 20 μm.


