
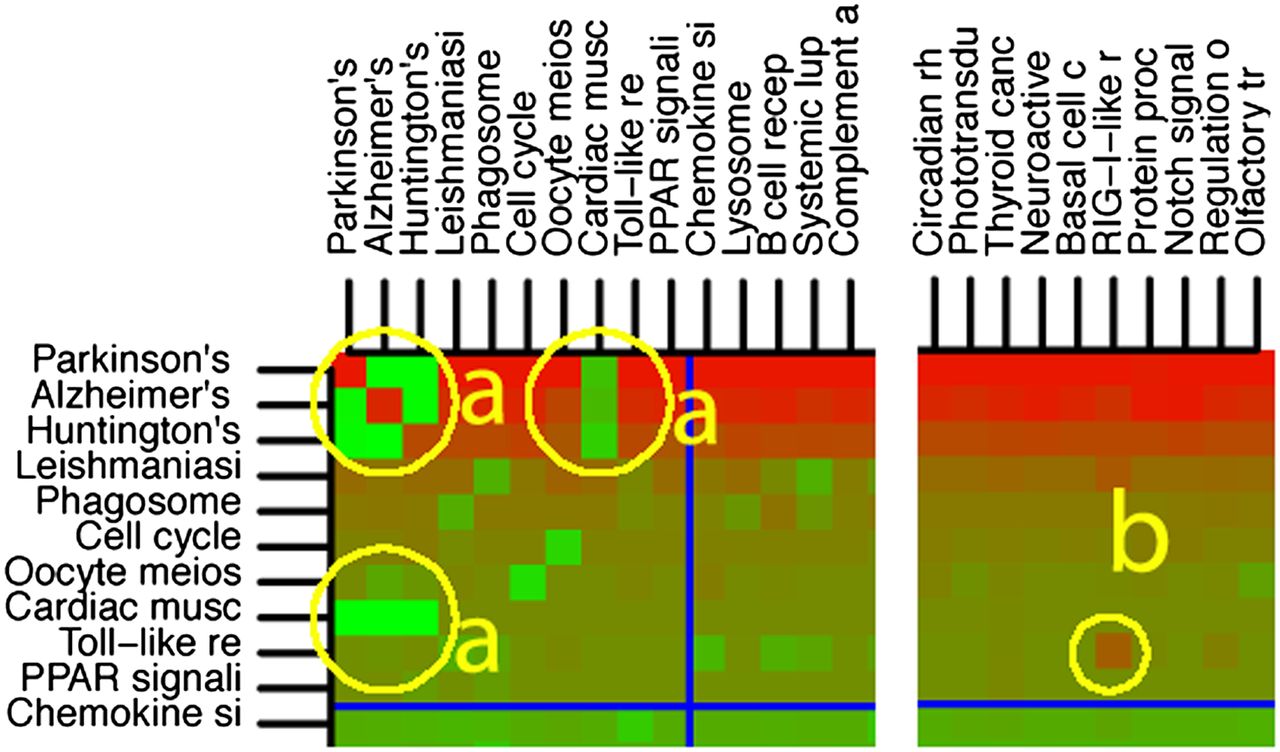
Figure 4.
Detail of the crosstalk matrix: comparison between days 3 and 0 in the CL treatment. Areas marked with a correspond to functional modules that are activated independently from the pathways they belong to. The cell marked with b corresponds to a specific part of the TLR pathway that is responsible for the immune response to host genetic material. Cells on the diagonal contain the P-values of the classical ORA, ordered from the most significant one to the least significant one. The cell Pi,j contains the P-value of pathway Pi after the effect of Pj is removed. The color of each cell represents the P-value: bright red for P-values close to zero, bright green for P-values close to 1.


